Clear Sky Science · en
Prediction of liquid accumulation in a shale gas pipeline
Why hidden water in gas pipes matters
Natural gas from shale rock is playing an ever larger role in meeting energy demand, especially in countries such as China. But getting that gas from remote wells to power plants is not as simple as pushing it through a steel tube. Water and other liquids can collect in low spots and uphill stretches of a pipeline, narrowing the flow path, wasting energy, and speeding up corrosion from the inside. This study explains where that trapped liquid comes from, how it piles up in a particularly hilly shale gas pipeline, and how operators can predict it well enough to plan cleaning operations before small problems become costly failures.
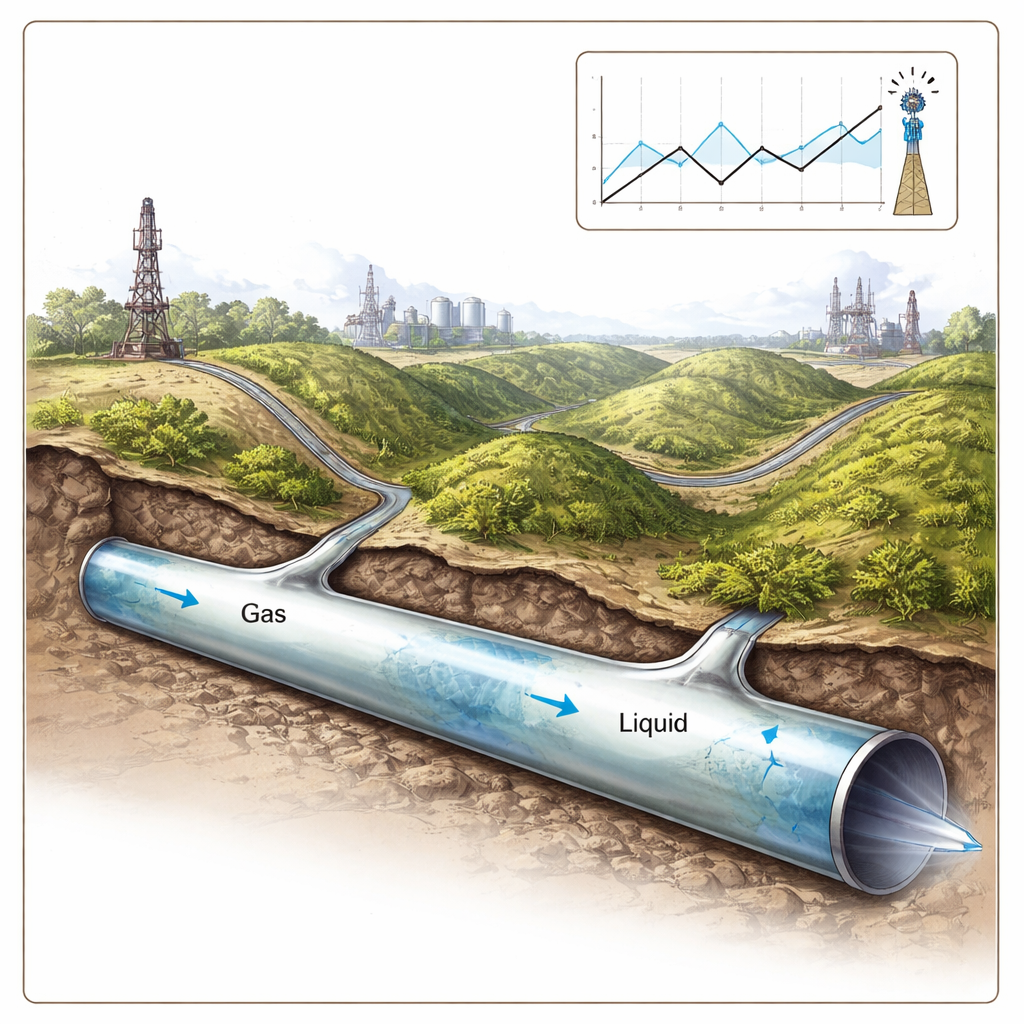
Hills, water, and the shape of the problem
The researchers focused on a real 5.45-kilometer shale gas gathering line in the Changning area of China. The pipeline does not run flat; instead, it climbs and dips repeatedly as it follows the landscape from a local gathering station to a central processing station. The gas it carries is mostly methane, but it also contains a small amount of water vapor that can condense into liquid as pressure and temperature change along the route. Because gravity pulls that liquid toward low points while the gas is trying to push it along, pockets of water can collect at the bottoms of dips and cling to uphill stretches. Over time, these pockets grow, eating into the pipe’s capacity and creating wet zones that are especially prone to rust.
Using virtual experiments instead of full-scale tests
Building and testing full-size pipelines under field conditions would be enormously expensive, so the team turned to OLGA, an industry-standard computer program that simulates how gas and liquid move together. OLGA solves detailed equations for mass, momentum, and energy for both gas and liquid, tracking how pressure, temperature, and liquid content evolve in time and space. The researchers digitally divided the pipeline into 500 segments and ran a 30-day "virtual" operation under realistic inlet and outlet conditions taken from the field. By checking that the simulated pressures and temperatures matched real measurements within a few percent, they gained confidence that the software was capturing the pipeline’s behavior well enough to explore different operating scenarios.
Finding the worst places and the biggest culprits
The simulations showed that, after about a month of steady operation, the total liquid in the line settled at roughly 67 cubic meters—about the size of a small backyard swimming pool. Most of this liquid gathered in uphill sections and at the very end of the pipeline, where the gas slows and gravity works hardest against it. To understand what most strongly controls how much liquid builds up, the researchers carried out a structured set of virtual tests, changing four everyday operating knobs: how much water enters the line, how much gas flows, the average pressure, and the average temperature. Using a statistical approach called an orthogonal design, they ran nine carefully chosen combinations of these settings and then fitted a simple mathematical formula that links those four factors to the daily rate of liquid buildup.
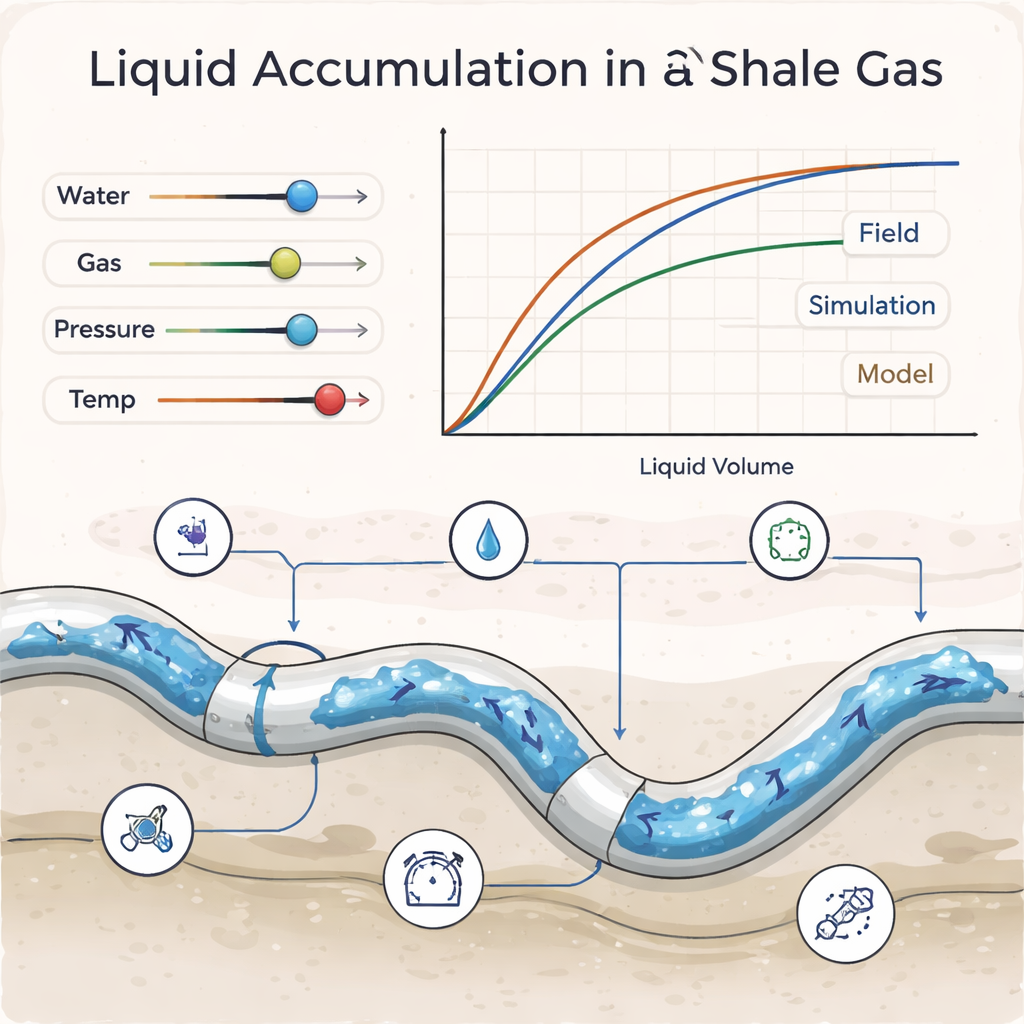
From complex physics to a practical rule of thumb
Although the underlying physics is complex, the fitted formula behaves like a rule of thumb that operators can use. It shows that pipeline pressure has by far the strongest influence on liquid accumulation: higher pressure tends to trap more liquid. The amount of water entering the pipe is the second most important factor, followed by gas flow rate, which actually helps carry liquid out when it is high enough. Temperature, within the range seen in the field, has little effect in comparison. A global sensitivity analysis—an examination of how uncertainties in the inputs ripple through to the result—confirmed that pressure dominates the outcome and that interactions between flow rates and pressure also matter. When the team compared their formula’s predictions with both field measurements and full OLGA simulations for a 30-day cleaning cycle, all three agreed within about 10 percent, acceptable accuracy for real-world planning.
Turning predictions into safer, cheaper operation
For nonspecialists, the key takeaway is that this work turns a hidden, hard-to-measure problem into a manageable one. Instead of guessing when to send cleaning devices, known as pigs, through the pipeline, operators can plug their current water rate, gas rate, pressure, and temperature into the new model to estimate how quickly liquid is building up and how long they can safely wait before cleaning. That makes it easier to prevent corrosion, avoid pressure surges, and keep gas flowing smoothly, all while reducing unnecessary maintenance. The authors suggest that future systems could combine real-time monitoring with such predictive tools to automatically adjust pigging schedules—keeping shale gas pipelines safer and more efficient as they snake through challenging terrain.
Citation: Zhao, Wd., Fang, Lp., Xie, Zq. et al. Prediction of liquid accumulation in a shale gas pipeline. Sci Rep 16, 6684 (2026). https://doi.org/10.1038/s41598-026-37157-y
Keywords: shale gas pipelines, liquid accumulation, multiphase flow, pipeline corrosion, pigging optimization