Clear Sky Science · en
Fire risk assessment using machine learning techniques: a case study of Jinan City, China
Why fire risk in one city matters to everyone
As cities grow larger and summers grow hotter, fires that once seemed rare are becoming more frequent and more damaging. This study looks at Jinan, a fast‑growing city in eastern China, to ask a simple but urgent question: where are fires most likely to break out, and when? By blending satellite data, maps of the city, and modern computer learning techniques, the researchers show how we can pinpoint high‑risk areas in detail and use that knowledge to better protect people, homes, and nearby forests.
Looking at fire as a citywide pattern
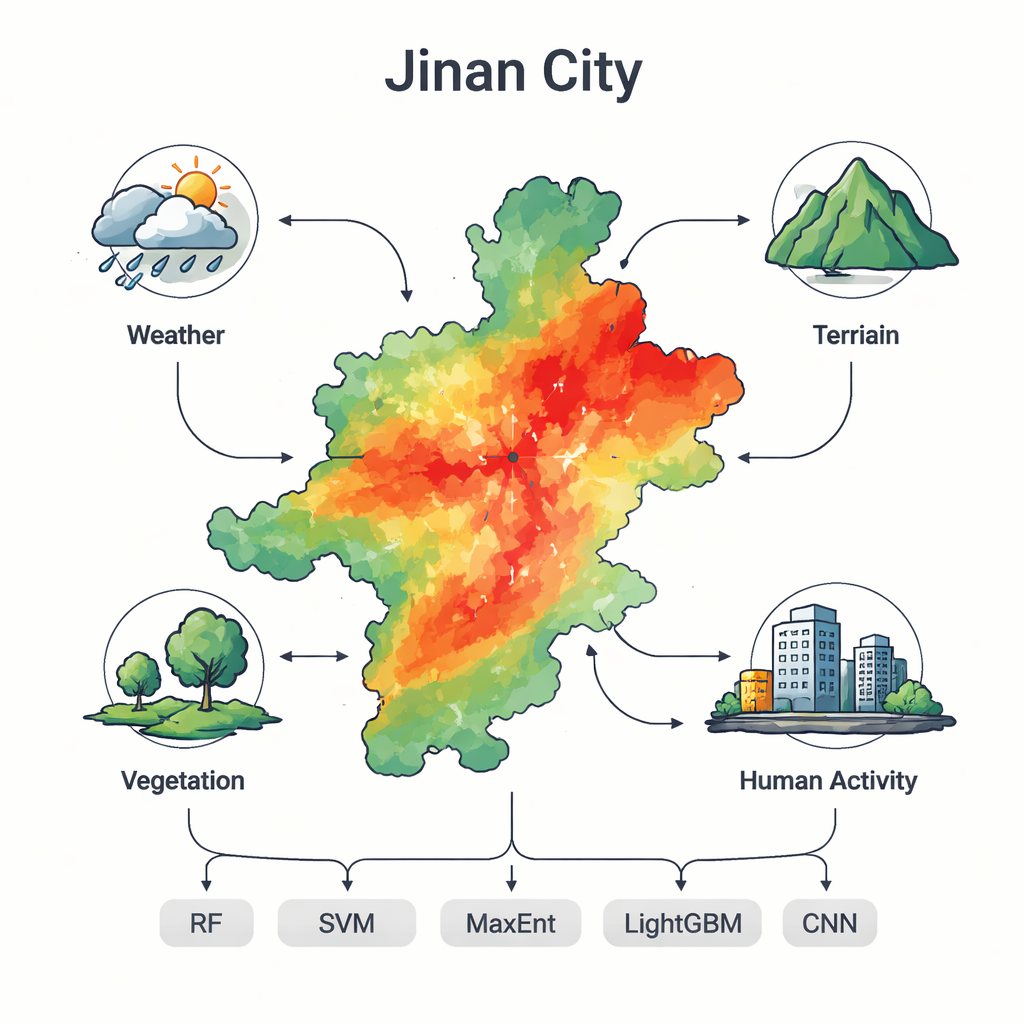
Rather than treating each fire as an isolated accident, the team viewed Jinan as a whole system. They collected records of more than 7,500 fires detected by satellite from 2001 to 2024 and paired them with 15 environmental factors. These included weather (such as rainfall, temperature, wind, and humidity), the shape of the land (elevation, slope, and aspect), vegetation (green‑ness and type of land cover), and signs of human activity (population density and distance to roads and rivers). All of these data were converted into map layers at a common resolution so that each point in the city could be described in the same way: how wet or dry it tends to be, how steep, how green, and how busy with people.
Teaching computers to recognize danger zones
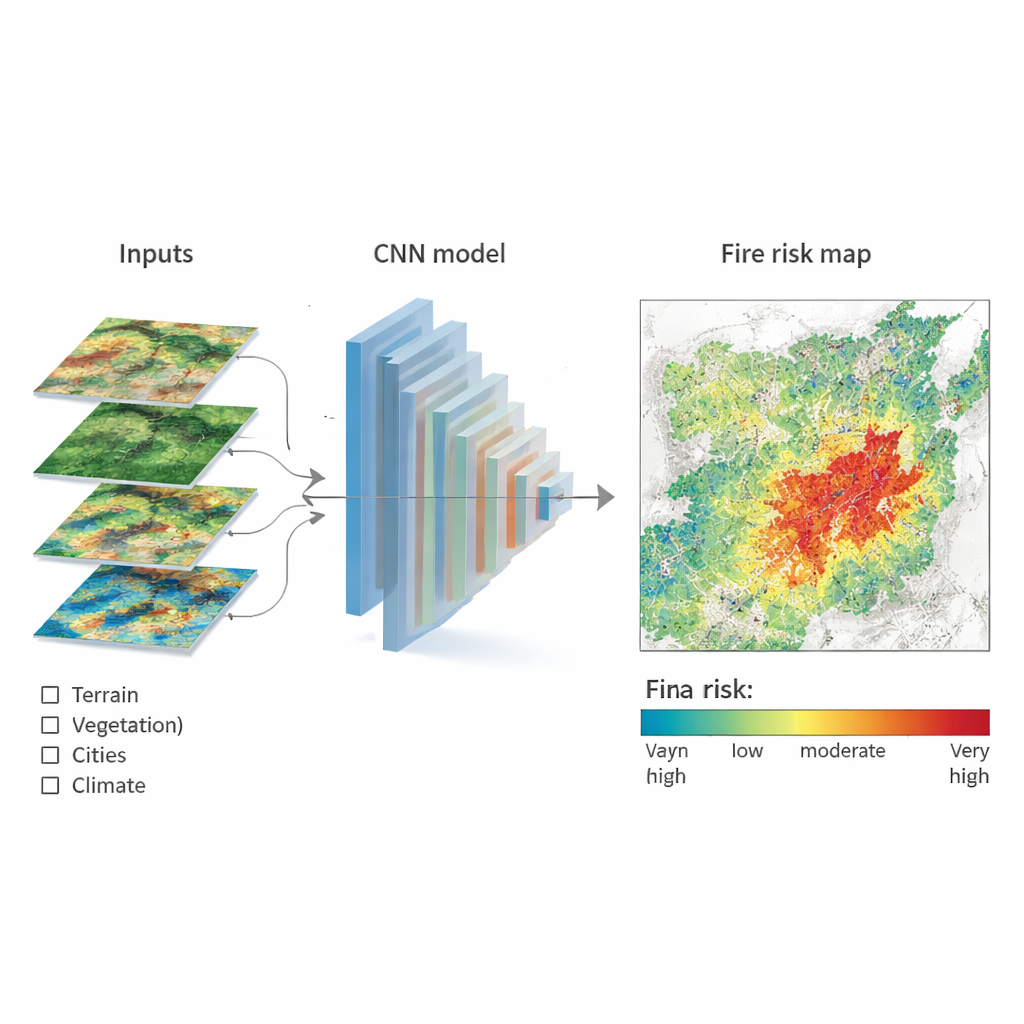
To turn this mountain of information into useful forecasts, the authors tested five different machine learning approaches. These ranged from well‑known methods such as Random Forests and Support Vector Machines to more advanced techniques, including Light Gradient‑Boosting Machines and a deep learning system called a Convolutional Neural Network (CNN). Each model was trained to tell apart locations where fires had occurred from similar locations where no fire was recorded. The models were then judged on how accurately they could classify new, unseen locations using measures such as overall accuracy, balance between missed fires and false alarms, and a curve‑based score known as AUC that reflects how well the model separates risky from safe areas.
What the maps reveal about where and when fires strike
The best‑performing tools were the CNN and the LightGBM model, both correctly predicting fire‑prone locations more than four out of five times and achieving very high AUC scores. The CNN had a slight edge, especially in drawing sharp boundaries between safer and riskier areas. Its maps showed a distinctive pattern described as “three high‑risk zones and two risk belts.” In simple terms, the most fire‑prone places cluster in and around central and southern urban districts, linked by two bands of elevated risk running across and down the city. Plains in the north and high mountains in the far south are generally less at risk. The analysis also highlighted which ingredients matter most: land use and land cover, along with vegetation greenness, turned out to be the strongest drivers, more so than long‑term averages of temperature or rainfall. In other words, how people shape and fragment the landscape, and how much fuel is present, matters at least as much as the background climate.
Seasons, neighborhoods, and human habits
Fire risk in Jinan is not constant through the year. By feeding season‑specific data into the CNN, the authors found that spring and summer stand out. Spring shows the widest spread of high‑risk areas, partly linked to traditional outdoor rituals that use open flames near dry grass and woods. Summer has the greatest number of actual fires, concentrated in built‑up districts where hot weather, heavy electricity use, and outdoor activities combine. Autumn brings scattered risk along farming and mountain edges, associated with crop residue burning, while winter shifts attention to dried vegetation and heating practices in rural and forested zones. When risks were tallied by district, Huaiyin emerged as the top priority for prevention, followed by Tianqiao, Gangcheng, and Zhangqiu, suggesting where fire services and public education could have the greatest impact.
What this means for safer cities
For a non‑specialist, the main takeaway is that fires in and around cities are neither random nor unavoidable. By learning from past events and reading subtle signals in weather, land, vegetation, and human activity, modern algorithms can draw detailed risk maps that show exactly where to focus patrols, upgrades to old wiring, vegetation management, and rules on open burning. In Jinan, the study shows that urban growth pressed up against flammable green spaces is a key recipe for trouble. The same pattern appears in many cities worldwide. Approaches like the CNN‑based maps used here offer local authorities a practical way to stay ahead of the next fire season instead of always reacting after the fact.
Citation: Wei, G., Han, GS. & Lang, X. Fire risk assessment using machine learning techniques: a case study of Jinan City, China. Sci Rep 16, 6410 (2026). https://doi.org/10.1038/s41598-026-37074-0
Keywords: urban fire risk, machine learning, satellite data, convolutional neural networks, disaster prevention