Clear Sky Science · en
Machine learning-enabled prediction of hemorrhagic transformation post-thrombectomy using quantitative DSA
Why this matters for stroke patients
When someone suffers a major stroke, doctors can sometimes pull the clot out of the brain’s main artery using a tiny device in a procedure called mechanical thrombectomy. This has transformed stroke care, but many patients still do poorly afterward because some develop new bleeding in the brain. The study behind this article asks a simple but crucial question: can we use information that doctors already collect in the operating room, plus modern machine learning, to predict which patients are most likely to bleed and need extra protection?
Looking beyond “artery open or closed”
Today, success after thrombectomy is usually judged by whether the blocked artery looks open again on angiography, a kind of real-time X-ray movie of blood vessels. But this coarse grading does not reveal what is happening in the brain’s tiny downstream vessels, where damage and bleeding actually occur. Some patients with perfect-looking large-vessel reopening still go on to develop serious brain hemorrhage, a complication called hemorrhagic transformation. The authors suspected that more detailed measurements of blood flow in these small vessels, taken from the same angiogram, might hold hidden clues about who is at risk.
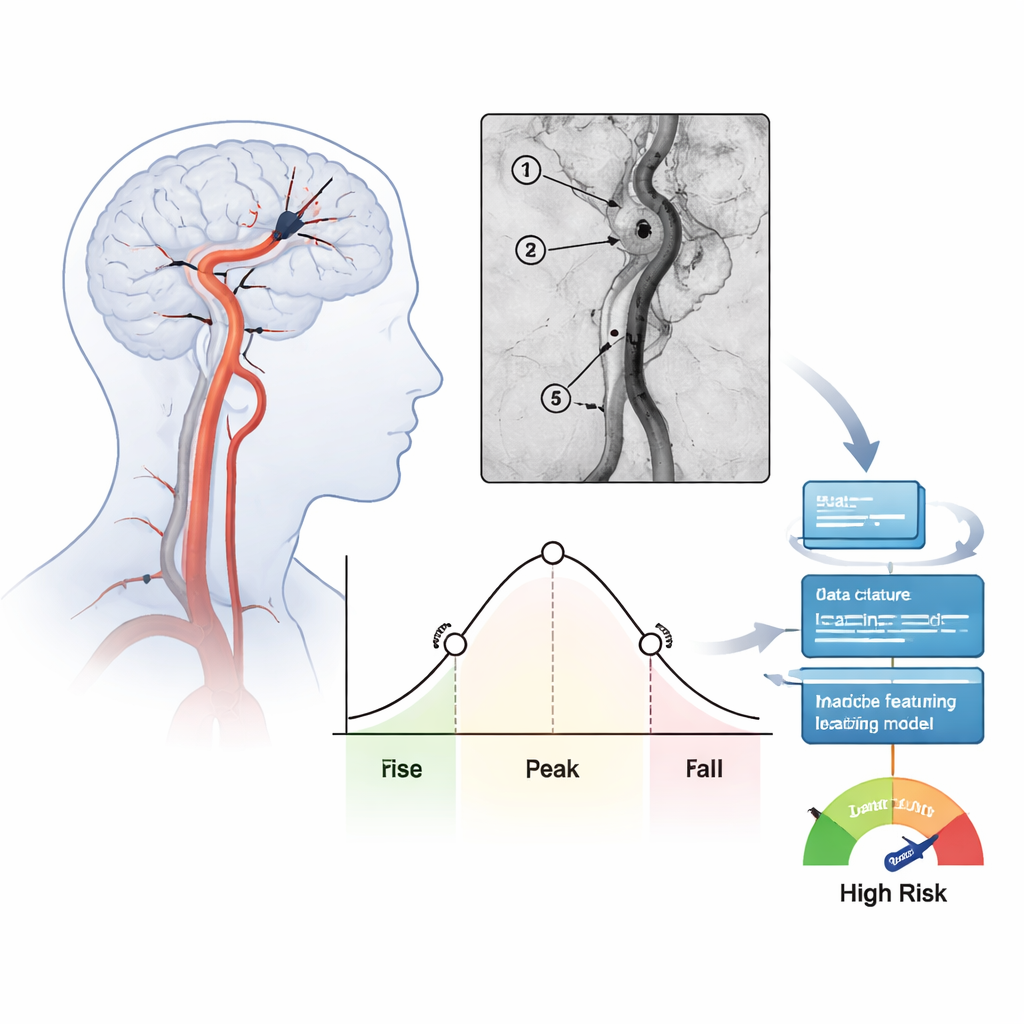
Turning angiogram movies into numbers
The team studied 171 people treated for severe strokes in the front part of the brain over one year at a single hospital. After doctors removed the clot and restored flow, they recorded standard angiography views and then analyzed how the injected contrast dye washed in and out of several key spots along the treated artery. For each region, they calculated timing measures such as how long blood needed to pass through (mean transit time) and how broad the main surge of contrast was (full width at half maximum). These numbers summarize whether blood moves slowly and steadily or shoots through quickly in a tight pulse. In total, 39 such flow features were extracted for every patient and checked for consistency between independent raters.
Teaching the computer to recognize risky patterns
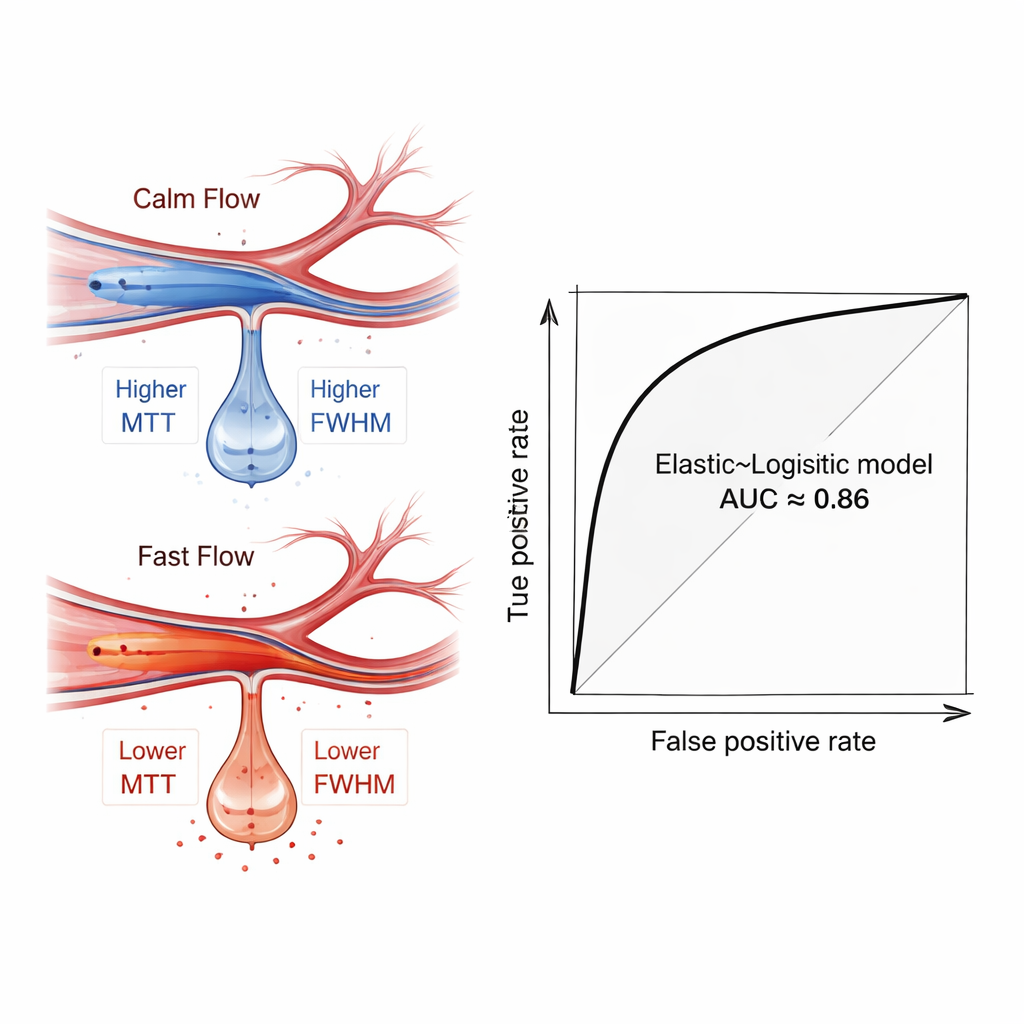
The researchers then used a set of common machine learning methods to see whether these flow features, alone or combined with basic clinical data like age and stroke severity, could distinguish patients who later developed brain bleeding from those who did not. To avoid overfitting, they first used five different feature-selection techniques to pick out the most informative measurements, and they repeatedly split the data into training and testing groups with cross-validation. Among many tested combinations, a relatively simple model—logistic regression, tuned with an “Elastic Net” feature filter—performed best. When it relied only on angiography-derived flow measures, it correctly separated patients with and without hemorrhage with an average area under the ROC curve of about 0.81. When clinical factors were added, performance rose to roughly 0.86, suggesting the model could be a strong decision aid.
What the blood-flow signals revealed
Diving into the trained models, the authors used an interpretability technique called SHAP to see which features mattered most. Measures capturing how long and how spread out the flow pulse was—especially in a more distant branch of the middle cerebral artery—stood out as key predictors. Patients who later bled tended to show faster, more focused flow in these distal vessels, reflected by lower transit times and narrower peaks. This pattern is a hemodynamic fingerprint of “hyperperfusion,” a state in which fragile brain tissue, suddenly flushed with high-speed blood after being starved, is more likely to leak and bleed. Importantly, this signal emerged even when simple group comparisons did not show dramatic statistical differences, underlining the value of multifeature, machine-based analysis.
How this could change care at the bedside
Because the method uses images that are already acquired during thrombectomy, it does not require extra scans, contrast, or radiation. Once regions of interest are drawn—a step that currently takes a few minutes—the computer can automatically compute flow measures and generate a personalized bleeding-risk estimate. In principle, this could help doctors tailor blood pressure targets, decide how aggressively to use blood-thinning drugs, and schedule earlier CT scans in patients flagged as high risk. The authors caution that their study is retrospective and from a single center, so larger, multi-hospital trials are needed before the tool can guide routine care. Still, it offers a clear proof of concept: by turning stroke angiograms into rich numerical data and letting machine learning sift through it, we can move beyond simply asking “Is the artery open?” to “Is the brain’s microcirculation safe?”—a shift that may ultimately spare more patients from dangerous post-treatment bleeding.
Citation: Li, H., Pang, C., Guo, X. et al. Machine learning-enabled prediction of hemorrhagic transformation post-thrombectomy using quantitative DSA. Sci Rep 16, 6008 (2026). https://doi.org/10.1038/s41598-026-37036-6
Keywords: stroke, mechanical thrombectomy, brain hemorrhage, machine learning, angiography