Clear Sky Science · en
Geospatial hotspots and neighbourhood deprivation associated with unintentional home injuries in British Columbia, Canada
Why home injuries are more than just bad luck
Most of us think of our homes as the safest places we spend our time, yet in British Columbia thousands of people are hospitalized every year after accidents that happen in kitchens, hallways, stairwells, and bathrooms. This study looks beyond individual mishaps to ask a bigger question: are there patterns in where these injuries occur, and do features of neighbourhoods—such as income, education, and housing type—help explain why some communities are hit harder than others?
Looking at injuries through a map
The researchers examined all hospital stays caused by unintentional injuries in and around the home across British Columbia from 2015 to 2019—more than 63,000 cases in total. These injuries included falls, burns, poisonings, and other household mishaps; falls, especially among older adults, were by far the most common. Instead of just counting cases, the team turned addresses into dots on a map and grouped them into local areas roughly matching towns, cities, or parts of cities. They then calculated how many people per 100,000 residents were hospitalized in each area, adjusting for differences in age so that older communities would not automatically look worse simply because they have more seniors.
Finding hotspots and cold spots
Using geographic statistics, the authors checked whether areas with high injury rates tended to be close to one another or were randomly scattered. They found clear clusters: neighbourhoods with high hospitalization rates were often next to other high-rate neighbourhoods, especially in and around Metro Vancouver and the southern part of Vancouver Island. Areas with consistently low rates were more common in northern and interior regions. In other words, home injury risk followed recognizable patterns on the map, suggesting that local conditions—rather than pure chance—play an important role.
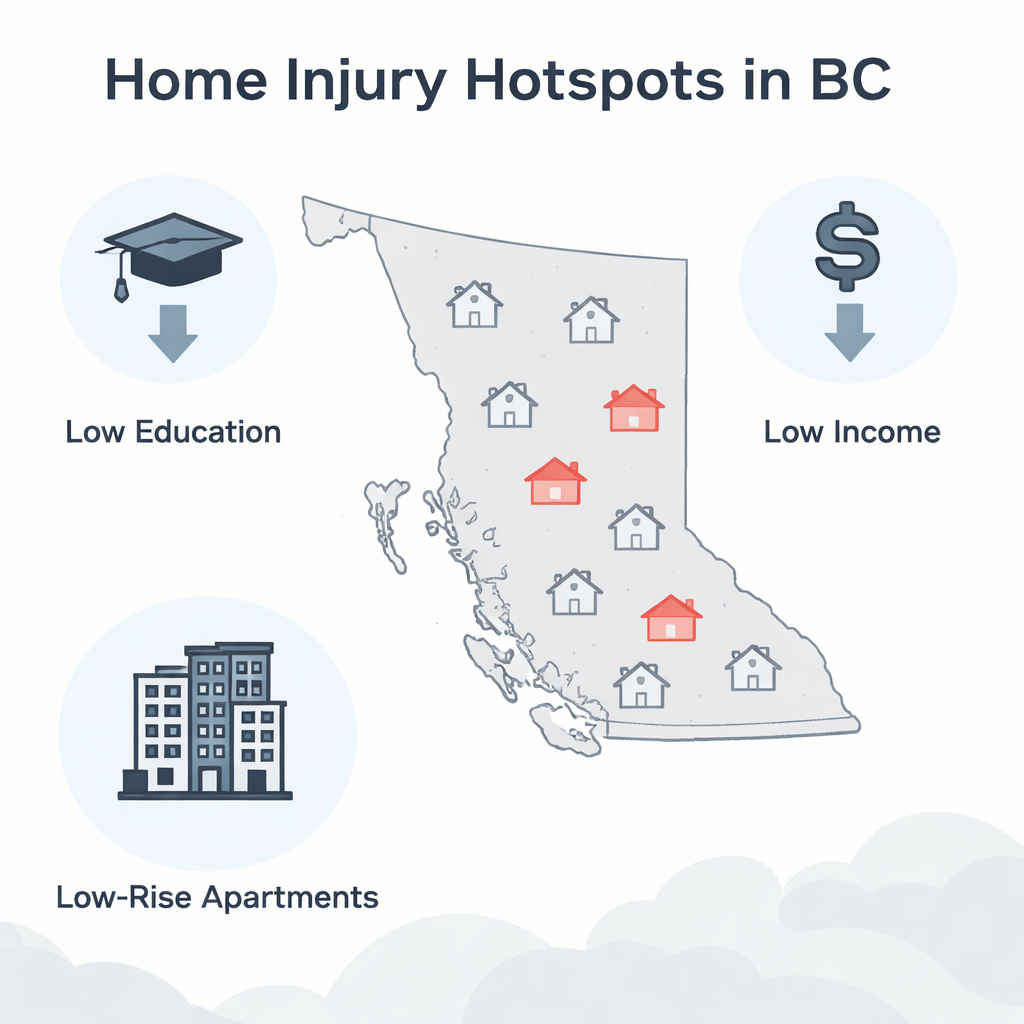
What neighbourhoods can tell us about risk
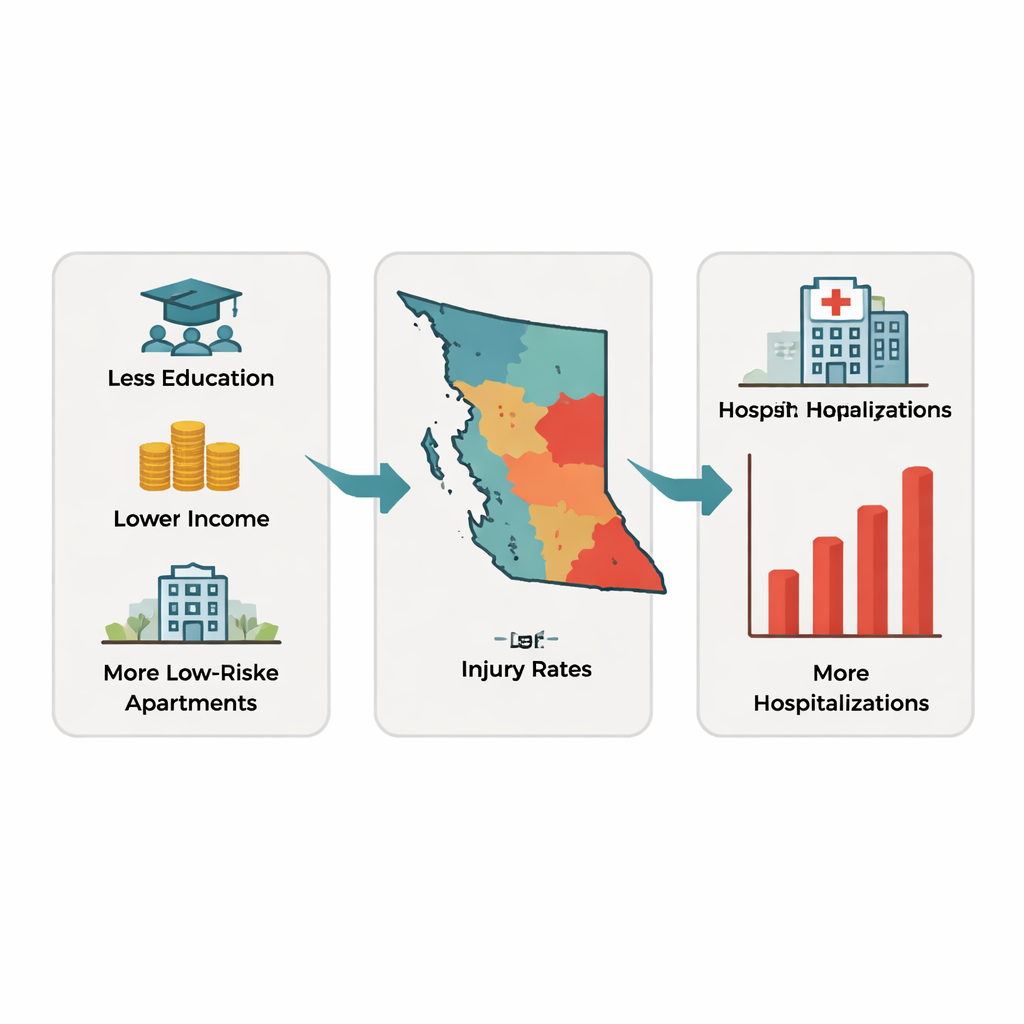
To understand what might drive these patterns, the researchers linked each area’s injury rate with census information. They tested many possible influences and settled on three that worked together reliably: how many adults lacked any formal educational certificate or diploma, the typical after-tax household income, and how many homes were in low-rise apartment buildings (fewer than five storeys). A statistical approach that allows relationships to vary from place to place showed that these three features explained about three-quarters of the differences in home injury hospitalization rates across the province. On average, injury risk rose sharply as the share of residents without formal education increased, fell slightly as incomes rose, and increased where there were more low-rise apartment units.
Homes, buildings, and unequal chances of getting hurt
The findings suggest that some British Columbians live in environments where everyday hazards are harder to avoid. Lower education and income can limit access to safer housing, home repairs, and safety equipment, and may be linked with less information or support for preventing falls and other mishaps. Low-rise apartment buildings, which often house a mix of older adults, families, and renters, may combine features such as aging stairs, cramped layouts, or inconsistent maintenance that increase the chance of accidents. The authors caution that these neighbourhood measures do not prove cause-and-effect for individuals, but they act as signals of broader social and physical conditions that shape risk.
Turning maps into safer homes
For a layperson, the study’s message is straightforward: serious injuries at home are not distributed evenly and are closely tied to where people live and the resources and housing options around them. By pinpointing geographic hotspots and linking them with education, income, and building type, the research offers public health agencies and local governments a roadmap for action. Instead of relying only on general safety campaigns, they can prioritize high-risk communities for home modification programs, fall-prevention services for seniors, stronger housing standards, and better fire and poison safety measures. In this way, the maps become tools to make everyday living spaces safer, especially for those in the most disadvantaged neighbourhoods.
Citation: Khudadad, U., McGaughey, T., Zheng, A. et al. Geospatial hotspots and neighbourhood deprivation associated with unintentional home injuries in British Columbia, Canada. Sci Rep 16, 6610 (2026). https://doi.org/10.1038/s41598-026-37031-x
Keywords: home injuries, British Columbia, neighbourhood deprivation, geospatial analysis, injury prevention