Clear Sky Science · en
Trends and oscillation characteristics of hourly PM2.5 levels in arid environment using wavelet coherence and lagged correlation
Why Dusty City Air Matters to Everyday Life
Fine dust and pollution in city air are not just abstract environmental problems—they affect how easily we breathe, how many people end up in hospitals, and even how much clean solar energy we can generate. This study focuses on Kuwait City, a rapidly growing desert metropolis that regularly experiences dust storms and extreme heat. By tracking air pollution hour by hour over eight years and comparing it with weather patterns, the researchers show when the air is dirtiest, how conditions are slowly changing, and which types of weather make things better or worse for both human health and renewable energy.
Life in a Desert City’s Air
Kuwait City sits in one of the hottest, driest regions on Earth, where summer temperatures often climb above 45 °C and powerful seasonal winds whip up vast amounts of dust. On top of this natural burden, traffic, oil refineries, power plants, and construction add their own cocktail of fine particles known as PM2.5—tiny bits of pollution small enough to enter deep into the lungs and bloodstream. Earlier studies in the region typically looked at daily or yearly averages, which smooth out the hour-to-hour spikes people actually breathe. This work instead uses hourly measurements from 2017 to 2024, allowing the authors to see how PM2.5 rises and falls across each day and season and how closely those swings are tied to temperature, humidity, wind, rainfall, and sunlight.
When the Air Is Dirtiest
The data reveal a clear daily rhythm in pollution. In Kuwait’s long, hot summers, PM2.5 levels climb through the day and reach their highest values in the evening, especially between 7 and 9 PM. July evenings, for example, averaged about 63 micrograms of PM2.5 per cubic meter of air—many times higher than the World Health Organization’s guideline. Early morning hours in winter, around 1 to 5 AM, show the cleanest air, with much lower and more stable particle levels. Over the course of a year, late spring and summer months such as May, July, and August stand out as the most polluted, while December and January tend to be cleaner. These patterns reflect the combined effects of dusty winds, heat, heavy energy use, traffic, and how well the atmosphere mixes and disperses pollutants at different times of day.
Is the Trend Getting Better or Worse?
To understand long-term change, the researchers applied statistical tools designed to pick out steady upward or downward trends, even in noisy environmental data. Most months showed a gentle decline in PM2.5 over the eight-year period, but only September displayed a clearly significant drop. This suggests a gradual overall improvement, possibly tied to changes in weather, dust activity, or emissions controls, while still leaving Kuwait City far above health-based guidelines for much of the year. For solar energy planners, this matters because heavy particle loads in the air cut down the amount of sunlight reaching panels. The observed downward trend, especially heading into autumn, hints at slightly better conditions for solar power generation than in earlier years, though summer remains challenging.
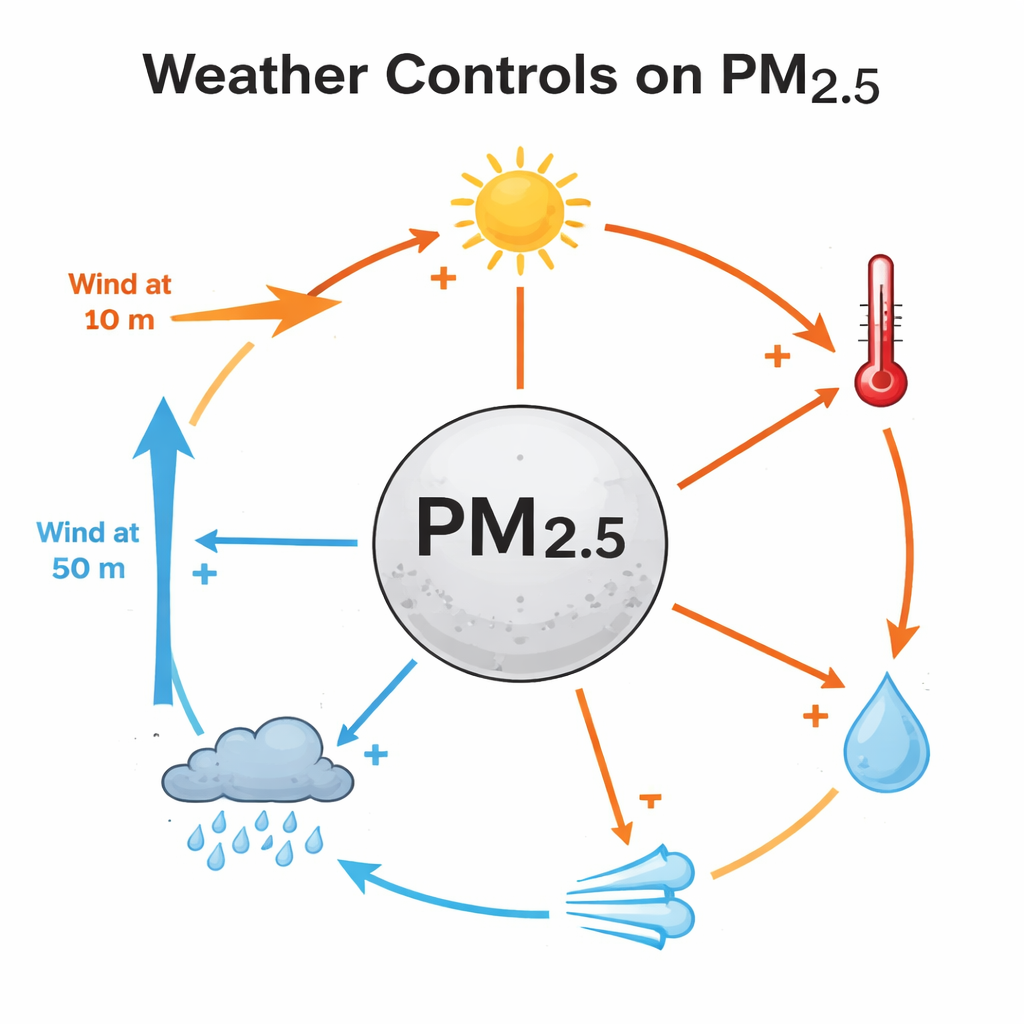
How Weather Steers Pollution Clouds
The heart of the study explores how weather conditions shape PM2.5, not just instantly but over days and months. Using advanced tools that examine how two time series “move together” across different timescales, the authors found strong, season-long links between PM2.5 and factors like temperature, air moisture, and solar radiation. Hotter, more humid periods tend to coincide with higher particle levels, as moist air helps particles grow and linger. Wind plays a double role: gentle winds near the ground can stir up local dust, raising PM2.5, while stronger winds higher up help sweep pollution away. Rain generally reduces particles in the short term by washing them out of the air, even though humid conditions before storms can briefly allow PM2.5 to build up. A detailed statistical model confirmed that high humidity tends to raise particle levels, while rainfall, stronger high-level winds, and brighter sunlight generally act to clean the air.
Pollution’s Delayed Response to Weather
A key insight from this work is that the air does not respond to weather changes instantly. The study tracked how strongly PM2.5 was linked to earlier weather conditions and found that the biggest effects often appeared many hours later. For example, changes in temperature showed their strongest impact on PM2.5 nearly a day afterward, and high humidity could influence particle levels for more than a full day. Winds also took many hours to fully disperse or transport dust. For city planners and health officials, these delays are valuable: they mean that by watching weather forecasts, authorities can anticipate pollution peaks 10 to 30 hours in advance and issue warnings, adjust traffic or construction schedules, or protect vulnerable groups before air quality deteriorates.
What This Means for Health and Clean Energy
In simple terms, the study shows that in a desert city like Kuwait, fine pollution particles follow predictable daily and seasonal cycles and are strongly governed by the weather—with effects that unfold over many hours. While there are signs of a slow decline in PM2.5, concentrations remain high enough to threaten health, particularly during hot, dusty evenings in summer when people are still active outdoors and electricity demand is high. Because the same particles also dim the sunlight that powers solar panels, understanding these patterns helps both doctors and energy planners. By linking pollution to specific weather conditions and time lags, the research supports smarter, weather-aware warning systems and cleaner urban design strategies aimed at reducing exposure, improving air quality, and making solar power more reliable in desert environments.
Citation: Kafy, A.A., Ibrahim, W.M., Baky, A.A. et al. Trends and oscillation characteristics of hourly PM2.5 levels in arid environment using wavelet coherence and lagged correlation. Sci Rep 16, 6827 (2026). https://doi.org/10.1038/s41598-026-36902-7
Keywords: PM2.5, air pollution, desert cities, Kuwait, weather and air quality