Clear Sky Science · en
Improved bayesian network with graph attention and prior algorithm for aircraft engine fault root cause analysis
Why hidden engine problems matter
Every commercial flight relies on jet engines that run for thousands of hours under blistering heat and pressure. When something goes wrong, airlines can lose millions from delays, cancelled flights, and unscheduled repairs. The deepest causes of serious engine failures often start as tiny cracks or chemical damage inside metal parts—things sensors cannot see directly. This paper presents a new way to trace faults back to those hidden origins, even when the data are scarce and skewed toward minor, everyday glitches.
The challenge of seeing the real culprit
Modern engines are so reliable that severe failures are rare. That is good for safety, but it creates a data problem: maintenance databases are packed with records of frequent, low-impact issues, while truly dangerous root causes appear only a handful of times. On top of that, sensors usually track higher-level symptoms—like loss of thrust or abnormal vibration—not microscopic damage such as grain boundary oxidation or tiny cracks. Traditional statistical methods and classic Bayesian networks, which learn cause–effect links mainly from how often things occur together, tend to focus on these common but less serious events. As a result, they often miss the rare, deep-seated faults that actually bring an engine down.
A layered map of how faults spread
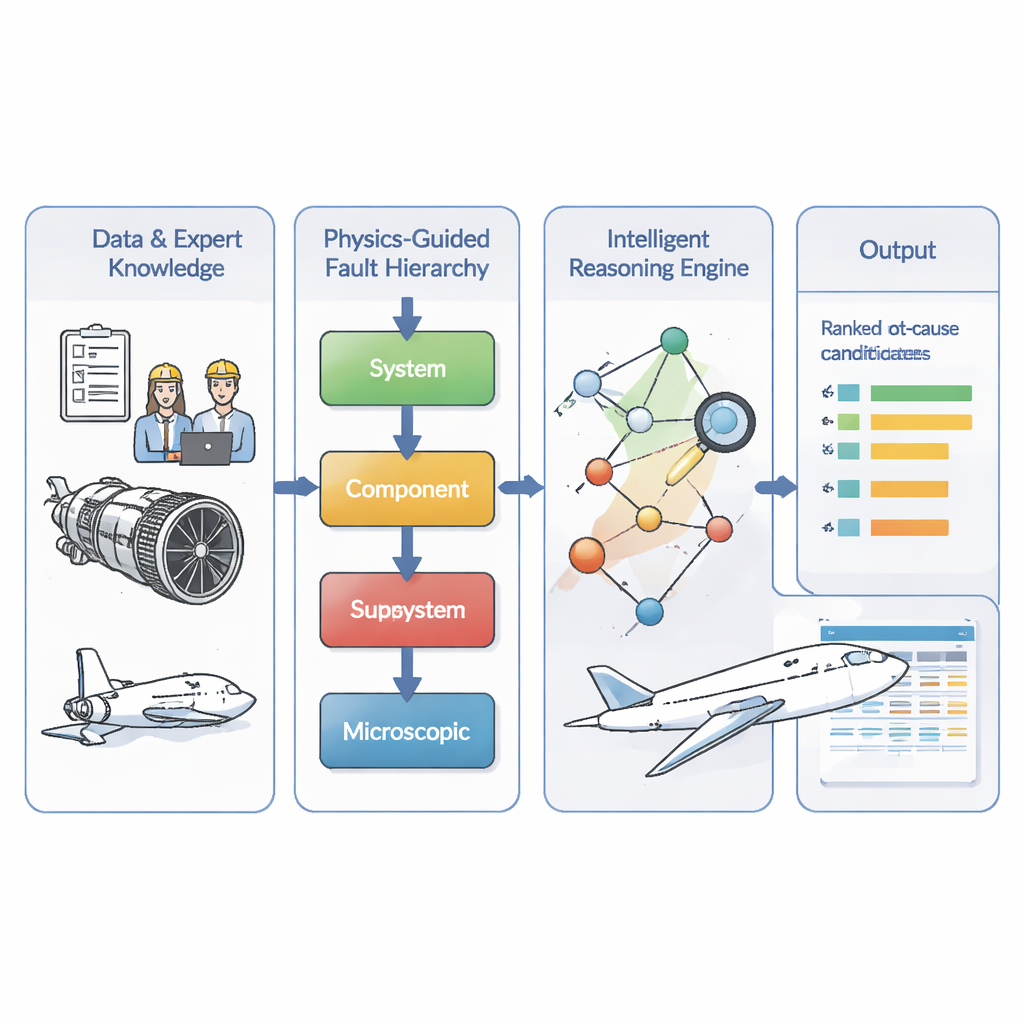
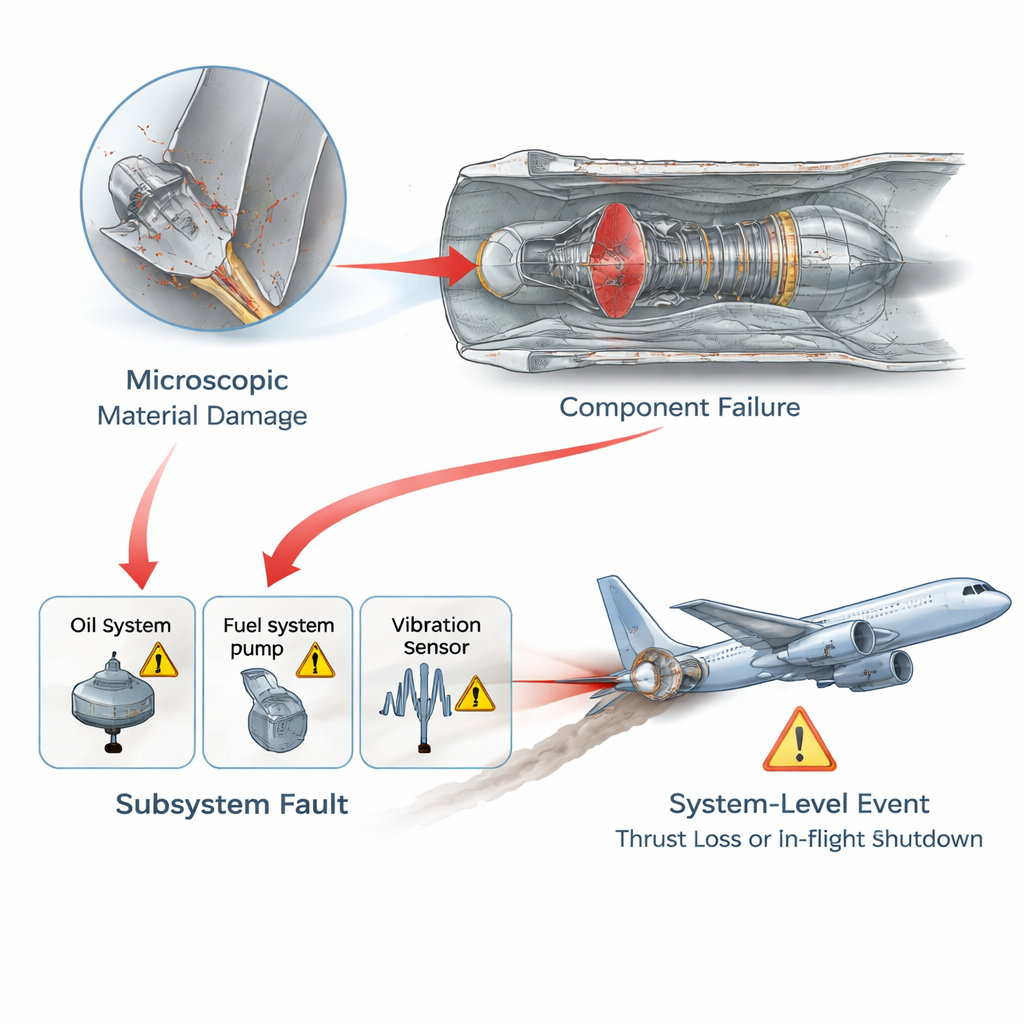
The authors tackle this by first encoding engineers’ understanding of how engine problems unfold. They divide faults into four levels: microscopic material damage, failure of a specific part, malfunction of a subsystem like fuel or lubrication, and finally system-level consequences such as in‑flight shutdown. Their model enforces a simple rule: causes must flow from deeper to higher levels—from micro damage to part failure to subsystem trouble to overall engine symptoms. This creates a directed “fault map” that mirrors physical reality and rules out impossible shortcuts or feedback loops that the limited data might suggest by accident. Building on maintenance records from 634 real engine events, the team uses a standard search procedure to fill in likely links within this layered structure, then has experts review and correct the resulting network.
Teaching the model what the data cannot show
Because the most dangerous faults are rare, the team adds two kinds of extra intelligence. First, they mine the entire dataset for association rules—patterns like “when this bearing fails, low oil pressure is often observed”—using a classic market-basket style algorithm. These rules are treated as prior knowledge about how likely one problem is to lead to another. A lightweight attention mechanism then learns how strongly to trust these priors at each level of the hierarchy. For example, when the model is estimating probabilities for microscopic causes with very few examples, it automatically leans more on global patterns and less on shaky local statistics. This adaptive blending helps correct the underestimation of deep faults that would arise from raw counts alone.
Letting the network highlight the truly critical faults
Second, the authors add a graph attention module that looks at the structure of the fault network itself. Each node—representing a specific fault or symptom—learns a compact numerical fingerprint based on its neighbors and how information flows through the graph. Using this, the model assigns every node a “criticality score” that reflects how central it is to serious fault chains, not just how often it appears. It also produces a separate, structure-based estimate of how strongly one node is likely to cause another. The final probability for any fault link is then a weighted blend of the data-driven estimate and this neural prior, where the weight depends on the criticality of the node. In simple terms, common but unimportant alarms are quietly downplayed, while rare but structurally crucial root causes are given extra attention.
Putting the method to the test
The researchers compare their full model—called GAT‑BN—to a lineup of alternatives, including standard Bayesian networks, a random forest classifier, a graph convolutional network, and a traditional engineering approach based on fault trees and failure mode analyses. Using two intuitive measures—how often the true root cause appears in the top one or top three predictions, and how close the predicted probabilities are to reality—the new method comes out ahead across the board. It is especially strong when data are scarce, when some records are incomplete, and when the root cause is a low-frequency microscopic fault. While GAT‑BN is computationally heavier than simpler models, the authors argue that its training and inference times remain practical for use on modern engineering workstations.
What this means for safer flights
For non‑specialists, the main message is that this work offers a smarter way to sift through messy maintenance data and complex expert knowledge to pinpoint the true starting point of engine failures. By combining a physics-based fault ladder, mined patterns from historical records, and a network that learns which problems really matter, the GAT‑BN model can more reliably flag rare but dangerous conditions before they escalate. Although the study focuses on one set of aircraft engines and uses a static view of faults, the approach suggests a broader path forward: future diagnostic systems may depend less on massive, perfectly balanced datasets and more on carefully structured knowledge blended with targeted machine learning.
Citation: Yuan, L., Han, G. & Dong, P. Improved bayesian network with graph attention and prior algorithm for aircraft engine fault root cause analysis. Sci Rep 16, 5924 (2026). https://doi.org/10.1038/s41598-026-36883-7
Keywords: aircraft engine faults, root cause analysis, Bayesian networks, graph attention, predictive maintenance