Clear Sky Science · en
Machine learning based variance estimation under two phase sampling using health and education sector data
Why smarter averages matter for real-world decisions
Whenever doctors study blood pressure or educators track student grades, they don’t just care about the average; they need to know how widely people differ around that average. This spread, called variability, guides how many patients to recruit for a trial, how big a tutoring program should be, or how confident we can be in policy decisions. The paper behind this summary introduces a new, statistically grounded way to measure that variability more precisely by blending classic sampling ideas with modern machine learning, tested on health and education data.
Measuring spread when information is incomplete
In an ideal world, researchers would know extra details about every person in a population before running a survey: ages, study habits, medical history, and more. In reality, that information is often spotty or expensive to collect. The authors work within a design called two-phase sampling to handle this. In the first phase, they take a large, relatively cheap sample and record simple background information, such as age or whether someone has internet access. In the second phase, they draw a smaller subsample and measure a more costly or time-consuming outcome, such as systolic blood pressure or final exam grades. The challenge is to use those two layers of information to estimate how variable the outcome really is in the entire population.
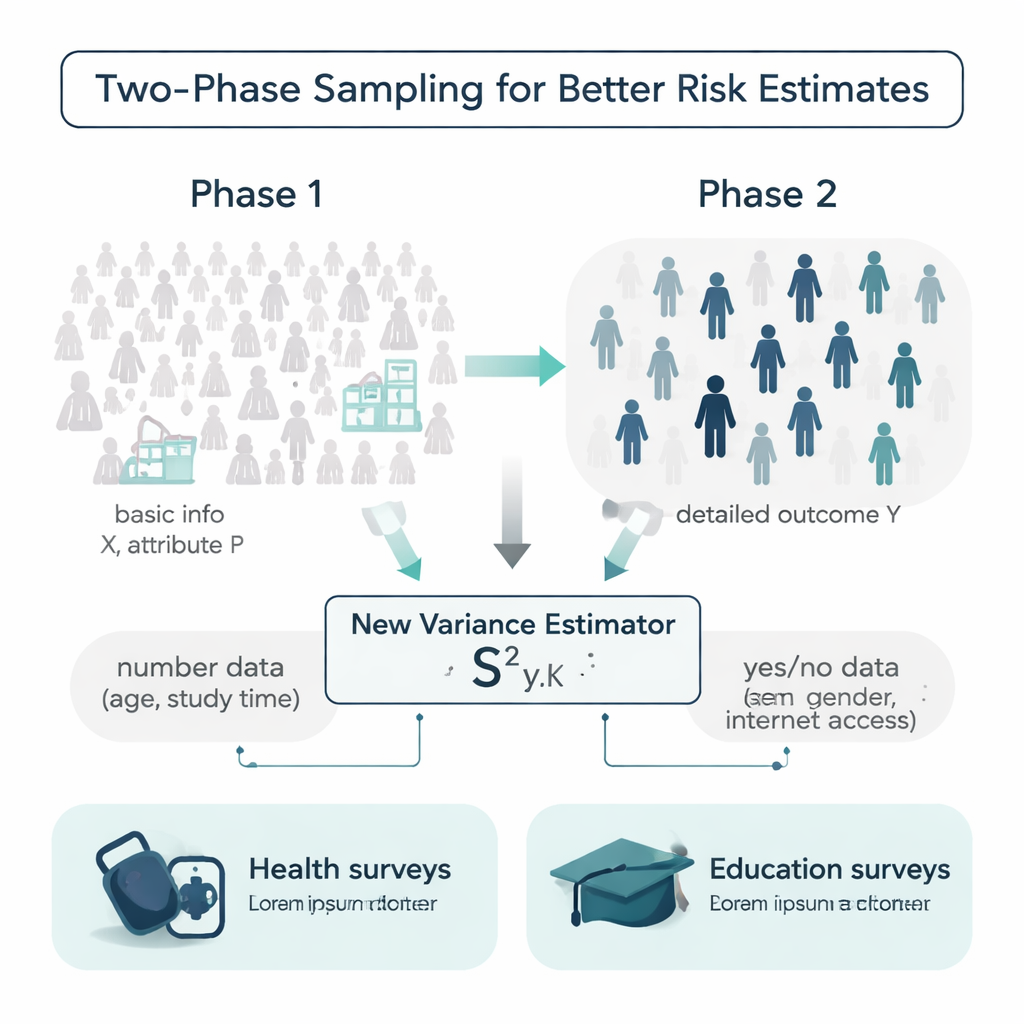
A new estimator that uses both numbers and yes/no traits
Most traditional tools for measuring variability rely only on the outcome itself or on a single helper variable, and they often assume the data follow convenient bell-shaped patterns. The authors propose a new estimator of variance that uses two kinds of extra information at once: a numerical helper (for example, age or weekly study time) and a yes/no attribute (such as gender or internet access). They show mathematically how this combined “mixture” estimator behaves, deriving formulas for its bias and mean squared error—two key measures of accuracy. Under reasonable conditions, the estimator is effectively unbiased and its expected error is smaller than that of widely used competing formulas, meaning it should provide sharper uncertainty estimates from the same amount of data.
Testing performance across many data worlds
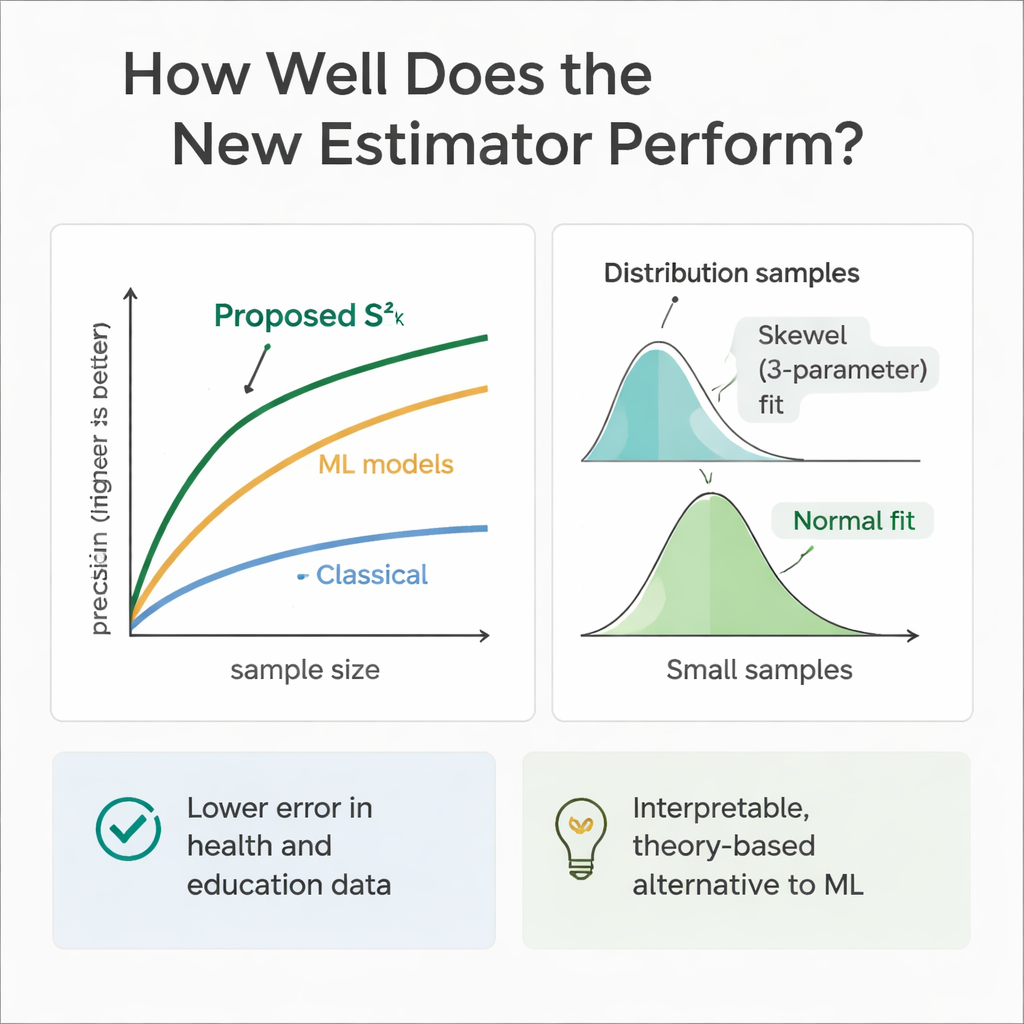
To check whether theory matches practice, the team ran extensive computer experiments. They simulated populations where the helper variables and the outcome followed a range of distributions, from symmetric (Normal and Uniform) to skewed (Gamma and Weibull). Using repeated sampling, they compared the new estimator’s error with that of several established methods across multiple sample sizes. In almost every setting, and especially as sample sizes grew, the new approach showed much higher relative efficiency—often cutting error by 30 to 70 percent compared with the classical variance estimator. The authors also examined how the estimator’s own sampling distribution behaves, finding that a flexible three-parameter Weibull curve describes it best for modest samples, while it tends toward a Normal shape as sample sizes become large.
Real data from clinics and classrooms
The method was then applied to two real-world case studies. In a health dataset, the outcome was systolic blood pressure, with age as the numerical helper and gender as the yes/no attribute. In an education dataset, the outcome was final course grade, the helper was weekly study time, and the attribute was whether the student had internet access. In both cases, the proposed estimator produced the smallest mean squared error among all tested statistical competitors, substantially tightening the estimated variability around the average blood pressure and around mean student performance. This improvement translates into more precise confidence intervals and more reliable comparisons between groups or interventions.
How it stacks up against machine learning
Because machine learning models excel at prediction, the authors also trained regression trees, random forests, and support vector regression on the same simulated health and education scenarios. These models, fed with the same helper variables, often matched or slightly surpassed the new estimator in pure predictive accuracy. However, they behave like black boxes: it is difficult to trace exactly how they combine information, and they lack the clean formulas needed for traditional survey inference. The proposed estimator, by contrast, is transparent and rooted in sampling theory, making it easier to justify in regulatory, clinical, or policy settings where explainability matters as much as raw performance.
What this means for surveys in practice
In plain terms, this work shows that researchers can get more reliable measures of spread without dramatically increasing sample sizes, simply by making disciplined use of even minimal extra information they already collect. By blending a numerical factor (like age or study time) with a simple yes/no trait (like gender or internet access) in a two-step sampling plan, the new estimator gives sharper, more stable variance estimates than long-standing methods. While advanced machine learning tools remain useful benchmarks, this approach offers a practical and interpretable middle ground, helping health and education analysts draw stronger conclusions from limited data.
Citation: Al-Marzouki, S., Nafisah, I.A., Dalam, M.E.E. et al. Machine learning based variance estimation under two phase sampling using health and education sector data. Sci Rep 16, 7760 (2026). https://doi.org/10.1038/s41598-026-36844-0
Keywords: survey sampling, variance estimation, machine learning, health data, education research