Clear Sky Science · en
Hierarchical bayesian fusion of inspection and monitoring data for probabilistic bridge deterioration assessment
Why Cracks in Bridges Matter to Everyone
Bridges quietly carry thousands of vehicles every day, yet their concrete decks slowly develop tiny cracks from traffic, weather, and age. If those cracks grow unnoticed, they can threaten safety and trigger costly repairs or closures. This article presents a new way to track and forecast how cracks in bridges evolve over time by combining two kinds of information that are usually kept separate: engineers’ periodic inspections and 24/7 sensor measurements. The goal is simple but vital—spot trouble earlier and plan maintenance before problems become emergencies.
Two Streams of Information, One Big Question
Modern bridges generate a surprising amount of data. Inspectors visit every year or so, record where cracks appear, how long and wide they are, and whether repairs are made. Meanwhile, permanently installed sensors can measure crack width, temperature, and movements every hour or even faster. Inspection data offer a long-term, big-picture view but are sparse in time. Sensor data reveal short-term fluctuations and trends but may cover only a few years and limited locations. Traditionally, engineers analyze these two data sources separately, which makes it hard to see the full story of how a bridge is aging and how close it is to needing major repairs. The authors ask: can we fuse both views into a single, constantly updated picture of deterioration?
A Layered Map of Bridge Health
To answer this, the study builds a three-layer statistical framework based on hierarchical Bayesian methods—a family of tools designed to combine uncertain information from many sources. At the bottom is the “dynamic state” layer, which captures how cracks change over time using high-frequency monitoring data. Here, the team models small, step-by-step crack growth as it reacts to daily temperature swings and past crack widths, using a sampling technique to handle randomness and measurement noise. Above that is the “deterioration risk” layer, which turns inspection records—crack counts, locations, types, and repair events—into estimates of how likely it is that parts of the bridge will reach a critical condition within a certain time. At the top sits a fusion layer, where these two views are merged. As fresh monitoring data arrive, the model updates its belief about the bridge’s health, much like a navigation app revises your travel time as traffic changes. 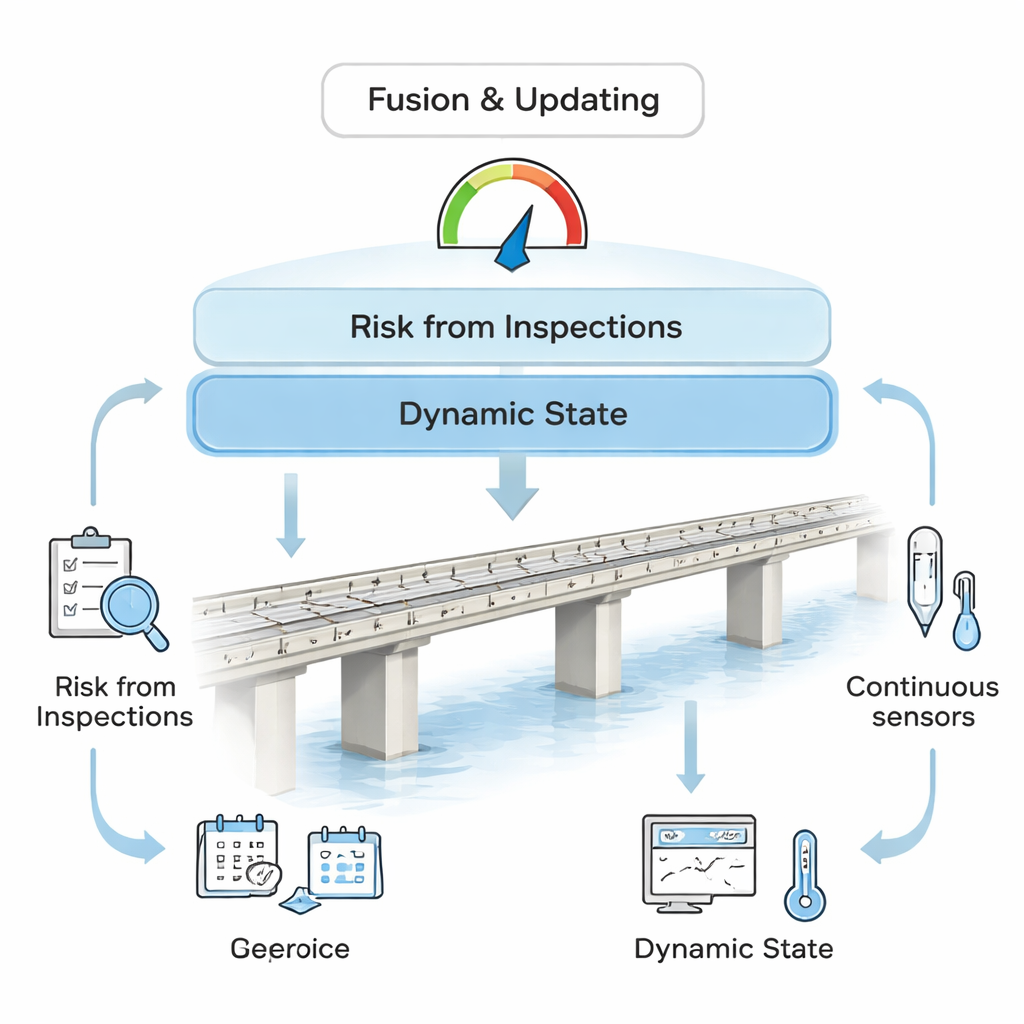
From Theory to a Real, Aging Bridge
The researchers tested their framework on the Fenghua River Bridge in China, a large concrete structure that has shown notable cracking for more than a decade. The bridge has both a long history of inspection reports and an extensive sensor network that continuously tracks crack widths and temperatures. Before analysis, the team carefully cleaned the data, removing outliers and checking that different crack measurements did not duplicate the same underlying information. They then used inspection records from 2014 to 2023 to build the initial risk model and monitoring data from 2023 to 2025 to refine it. The fused model highlighted which crack locations and orientations were most dangerous and showed that some parts of the bridge deteriorate much faster than others, arguing for targeted repairs instead of uniform, one-size-fits-all maintenance. 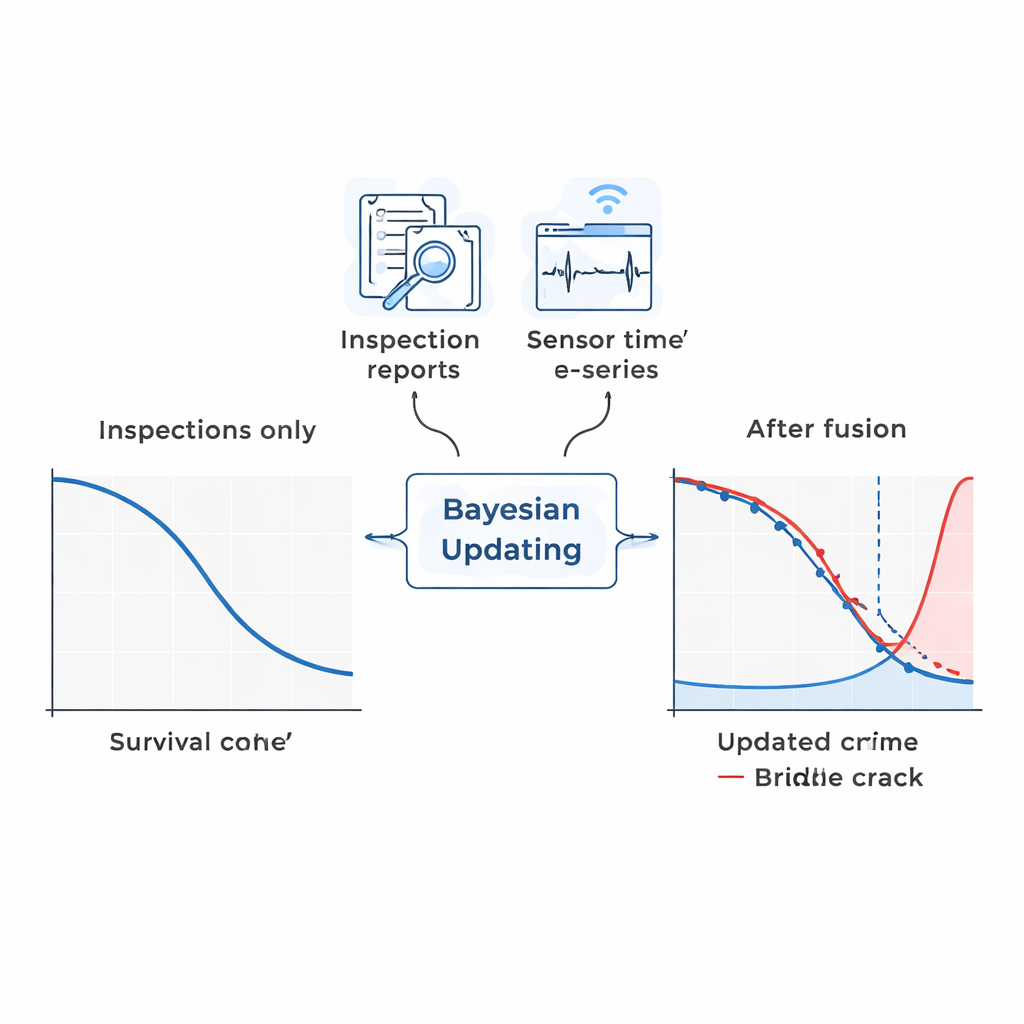
A Clearer Forecast of Future Damage
When the authors compared their fused model to traditional approaches that rely on inspection data alone, the difference was striking. By checking predictions against independent inspection results from 2024 and 2025—data the model had not seen during training—the new method reduced prediction errors by nearly a quarter. It was better at capturing early signs of speeding deterioration, especially when monitoring data indicated that crack growth was accelerating. The updated model also produced more reliable estimates of how long different cracked regions are likely to survive before needing repair, and it did so while clearly showing which factors—such as where a crack sits along the span or what type of crack it is—contribute most to risk.
What This Means for Everyday Travel
For non-specialists, the takeaway is reassuring: by intelligently blending what inspectors see on site with what sensors record around the clock, engineers can build a more truthful and timely picture of how bridges age. This layered, probabilistic approach does not eliminate uncertainty, but it narrows it and keeps updating as new evidence arrives. That makes it easier for agencies to schedule maintenance before damage becomes severe, stretch limited repair budgets further, and keep bridges open and safe. In short, the method offers a smarter way to listen to what bridges are telling us about their health—and to act before cracks turn into crises.
Citation: Wang, B., Chen, K. & Wang, B. Hierarchical bayesian fusion of inspection and monitoring data for probabilistic bridge deterioration assessment. Sci Rep 16, 5965 (2026). https://doi.org/10.1038/s41598-026-36808-4
Keywords: bridge deterioration, structural health monitoring, Bayesian data fusion, crack growth, predictive maintenance