Clear Sky Science · en
The CHOVE-CHUVA Earth observation platform to monitor socio-environmental dynamics in Mato Grosso, Brazil
Watching a Changing Land from Space
The southern Amazon state of Mato Grosso in Brazil is one of the world’s most important frontiers for farming, forests, and freshwater. It feeds global demand for soy and beef, but this growth has come with deforestation, water stress, and climate risks. The CHOVE-CHUVA project presents a new online platform that turns streams of satellite images and local observations into simple maps and graphs, helping citizens, farmers, NGOs, and public agencies see how their land is changing over time and what that means for the environment.
A Digital Window on Mato Grosso
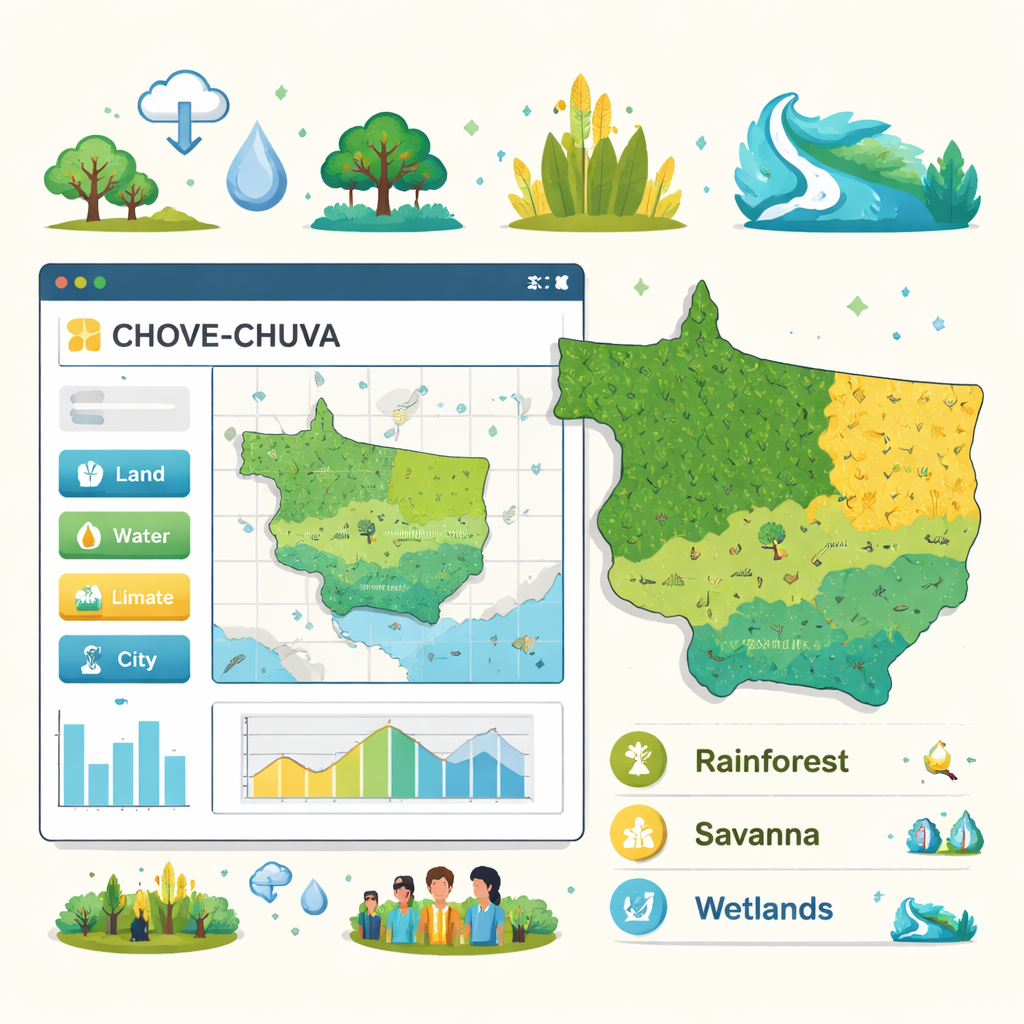
Mato Grosso is roughly the size of France and hosts three major natural regions: dense Amazon rainforest, Cerrado savanna, and the Pantanal wetlands. Over recent decades, vast areas of forest and savanna have been converted to pastures and large soy and maize fields, while rivers have been reshaped by thousands of small reservoirs and big hydropower dams. At the same time, Brazil has pledged to reduce greenhouse gas emissions and adopt low‑carbon farming. This mix of pressure and promise makes Mato Grosso a key place to track how human activity and nature interact. The CHOVE-CHUVA platform was co-designed with local NGOs and state agencies to meet their real information needs, from monitoring protected areas to showcasing farms that adopt better practices.
Bringing Many Kinds of Maps Together
One of the platform’s main strengths is that it gathers a wide range of existing datasets into a single interface that non‑experts can use. Users can see where indigenous territories, conservation units, and land reform settlements are located, and how these overlap with private farms registered in Brazil’s Rural Environmental Registry. They can explore detailed land‑use maps that show where forest, pasture, cropland, and urban areas have expanded or shrunk each year since the 1980s. Hydrology layers describe river networks, water sources, and reservoirs, while climate layers summarize decades of rainfall, the timing of the rainy season, and extreme downpours. All of this information can be summarized for any chosen area, such as a municipality, a watershed, or a user‑drawn polygon.
Turning Big Data into Simple Indicators
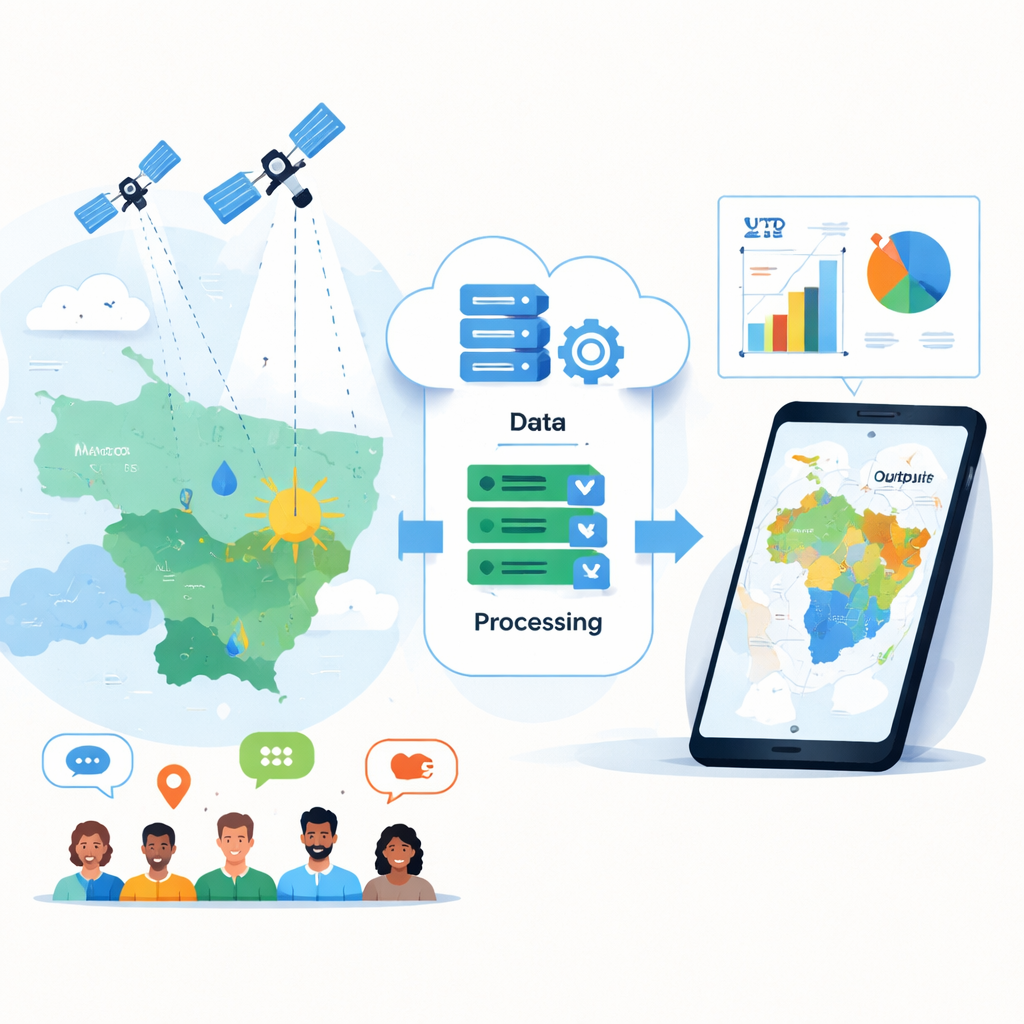
Behind the scenes, the platform relies on a French open‑source system called PRODIGE, together with a spatial database and automated scripts, to process satellite and other data. For any selected area, CHOVE-CHUVA computes indicators “on the fly,” such as how much forest was cleared each year, how fragmented the remaining forest has become, how cropping systems have shifted from single to double harvests, how many irrigation pivots or fish ponds exist, and how much non‑forest vegetation has been lost along rivers. Rainfall records from an international dataset are turned into clear charts of annual totals, rainy‑season start and end dates, and trends in very wet or very dry days. These ready‑made summaries help bridge the gap between technical Earth‑observation products and people who simply want to know what is happening in their region.
Inviting Citizens into the Mapping Process
CHOVE-CHUVA goes beyond one‑way information delivery by allowing users to add their own mapped observations. Through a simple drawing tool over recent satellite images, people can outline small patches of forest being restored, farms that use integrated crop‑livestock‑forest systems, or properties certified for responsible soy production. These land uses are still relatively rare and scattered, so local knowledge is crucial to build up reliable samples. The project team views this as a first step toward a broader “citizen observatory,” where residents not only provide factual locations but can also share their interpretations of why changes are happening and how they experience climate shifts on the ground.
Improving and Expanding the Platform
The authors see the current platform as a foundation rather than a finished product. They plan to add newer satellite‑based layers on topics like forest regrowth, tree height, pasture management, urban growth, water‑level changes, and air quality. They also aim to let users compare multiple competing datasets—for example, different deforestation maps—to highlight agreements and disagreements that matter for policies such as the European rules on deforestation‑free supply chains. Technical upgrades will make it easier to access live web map services, handle larger areas without slowdowns, and view the platform on phones and tablets. Training programs in schools and local governments are planned so that teachers, students, and community leaders can use CHOVE-CHUVA for environmental education and local planning.
Why This Matters for Everyday Life
In plain terms, the CHOVE-CHUVA platform turns complex satellite records and government databases into understandable pictures of how land, water, and climate are changing in Mato Grosso. By putting many themes in one place, summarizing them for any chosen area, and inviting local contributions, it helps make environmental information more transparent and more directly useful. For people who live in or depend on the Amazon and its surrounding regions, this kind of shared, easy‑to‑read evidence can support better decisions—whether that means protecting a river, adjusting a cropping system, or tracking progress toward climate and conservation promises.
Citation: Arvor, D., Denize, J., Rouxel, L. et al. The CHOVE-CHUVA Earth observation platform to monitor socio-environmental dynamics in Mato Grosso, Brazil. Sci Rep 16, 6497 (2026). https://doi.org/10.1038/s41598-026-36640-w
Keywords: Earth observation, Mato Grosso, deforestation, citizen science, land use change