Clear Sky Science · en
The influence of study area selection and landslide inventory practices on landslides spatial distribution: an example from Northern Morocco
Why the Shape of a Map Matters for Landslides
Landslides are not just dramatic cliff collapses on the evening news; they are a quiet but deadly hazard that threatens towns, roads and infrastructure worldwide. To plan safely, authorities often rely on landslide susceptibility maps, which show where slopes are most likely to fail in the future. This study from northern Morocco asks an overlooked question: how much do these maps depend on the way we draw their borders, and on which past landslides we choose to learn from?
Three Ways to Draw the Same Landscape
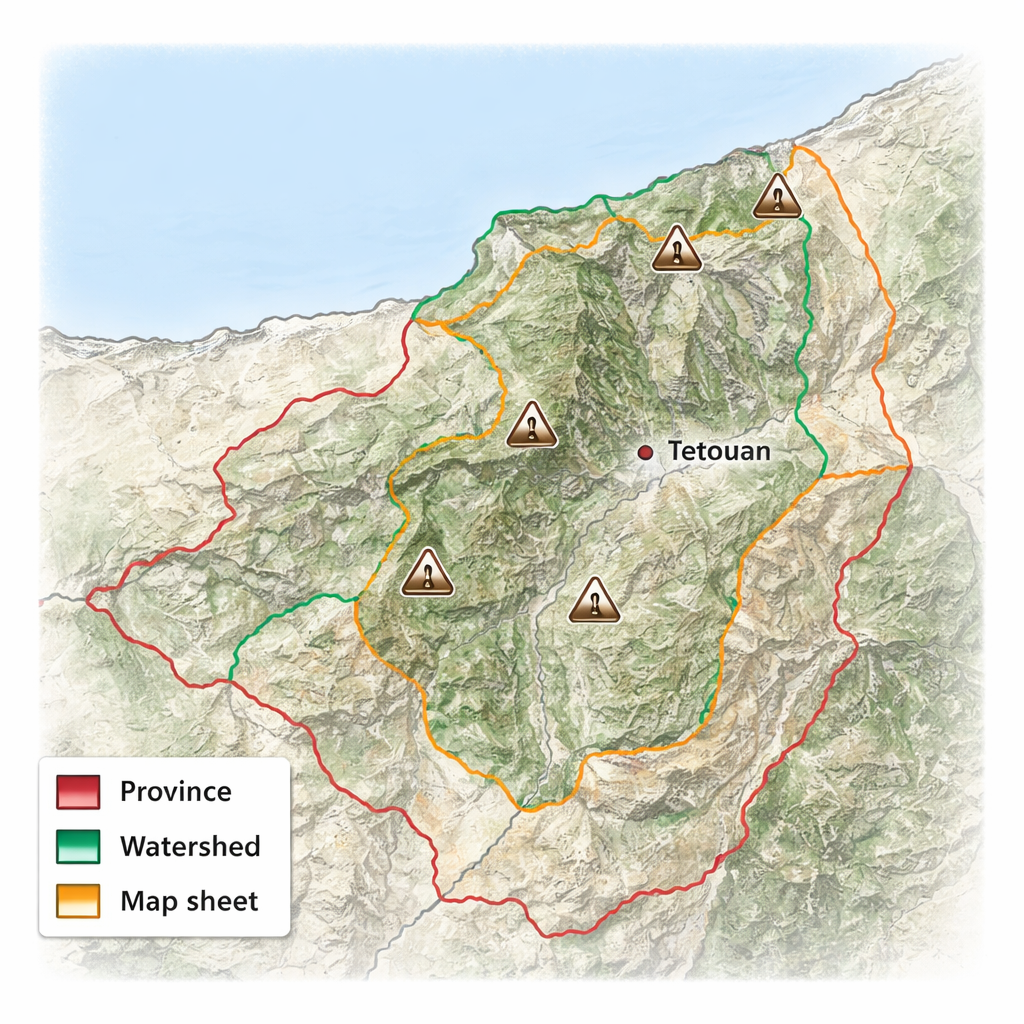
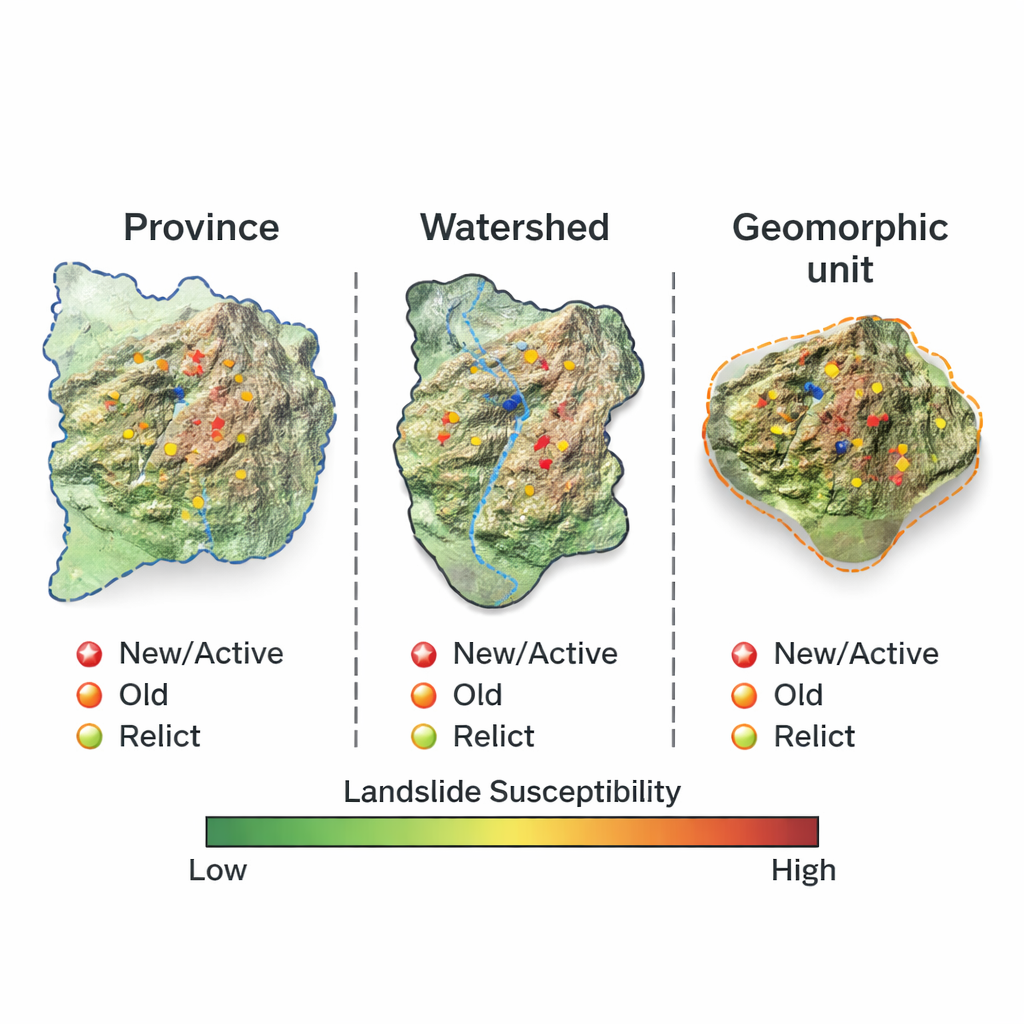
The researchers focused on a mountainous region around the city of Tetouan in northern Morocco, where the Rif mountains meet the Mediterranean Sea. They compared three different ways of carving up essentially the same terrain: a political province boundary, a cartographic rectangle corresponding to a 1:50,000 topographic map, and a naturally defined Martil River watershed. Although these areas overlap, they do not capture the same geological reality. In particular, the province boundary lumps together two very different mountain domains: an “Internal Rif” made mostly of older, metamorphosed rocks cut by normal faults, and an “External Rif” built from younger sedimentary rocks and thrust faults. The central idea is simple: if we mix such contrasting landscapes inside one study area, our statistics may blur or even distort the real controls on landslides.
Looking Back at Old and New Slope Failures
To understand how past events shape predictions, the team built a detailed landslide inventory of more than 5,000 events, painstakingly compiled from aerial photographs, satellite images, historical maps, fieldwork, and local interviews. They sorted these landslides by age and activity: new and active events since the very wet years around 2003–2010, young but now inactive landslides that occurred earlier, and large, old “relict” landslides carved during past climatic and tectonic episodes. They then tested how well the size distribution of landslides in each group matched expected mathematical patterns, showing that their catalog is statistically complete from small slips to giant slope failures. This allowed them to ask which generation of landslides best represents today’s hazard.
How the Border Changes the Picture
The team used two widely adopted modeling tools—logistic regression and artificial neural networks—to turn the landslide inventory and a set of conditioning factors (such as slope steepness, rock type, elevation, and distance to faults and streams) into susceptibility maps. When they modeled only the External Rif—essentially what is captured by the watershed and the map sheet—results were stable: both techniques and different age groups produced broadly similar patterns, with higher susceptibility in deeply incised valleys and near thrust faults. But when they expanded the study to the full province, including the contrasting Internal Rif, the picture changed. In the coastal Internal Rif, recent landslides cluster along steep sea-facing slopes shaped by extensional tectonics, whereas relict and older landslides are scarce. Mixing these two domains in one statistical model weakens or “attenuates” the links between landslides and their controlling factors, because relationships that are strong in one domain do not hold in the other.
Why Old Landslides Don’t Always Predict New Ones
The authors also tested how well susceptibility maps built from older and relict landslides could predict the location of recent events. They did this by reserving only post‑2003 landslides for validation, instead of randomly splitting the data as is often done. Across all three study areas, models based solely on old or relict landslides performed noticeably worse than those built from younger events. The oldest, largest landslides tend to sit higher on the slopes, recording wetter climatic periods and different base‑level conditions in the distant past. In contrast, today’s active landslides are generally smaller, more shallow, and concentrated in lower and mid‑slopes where modern runoff and human activity now dominate. This vertical shift through time—large relict failures high on the slopes, younger ones progressively lower—shows that using very old events to forecast present‑day risk can be misleading.
Practical Lessons for Safer Planning
For non‑specialists, the message is straightforward. Landslide susceptibility maps are powerful tools, but they are only as reliable as the choices that go into them. Drawing study areas along political borders, or lumping together geologically distinct mountain blocks, can hide the real causes of slope failure and reduce predictive accuracy. Likewise, relying on very old landslides that formed under different climates and tectonic regimes may produce impressive‑looking models that are poor guides to where the next damaging landslides will occur. The authors argue that future mapping efforts should be designed around natural geomorphological units and should train models primarily on landslides that reflect current conditions. Done this way, landslide maps can better support urban planning, infrastructure design, and disaster preparedness in mountainous regions like northern Morocco and beyond.
Citation: Bounab, A., Sahrane, R., El Kharim, Y. et al. The influence of study area selection and landslide inventory practices on landslides spatial distribution: an example from Northern Morocco. Sci Rep 16, 5613 (2026). https://doi.org/10.1038/s41598-026-36587-y
Keywords: landslide susceptibility, geomorphology, Northern Morocco, hazard mapping, mountain risk