Clear Sky Science · en
Predicting dialyzer fiber blocking is hard due to high intrapatient variability and limited utility of thrombin generation markers
Why dialysis machine clots matter
For people whose kidneys have failed, hemodialysis is a life‑sustaining treatment that cleans the blood several times a week. The work is done inside a cartridge packed with thousands of tiny hollow fibers. When these fibers clog with clotted blood, treatment becomes less effective and potentially less safe. Doctors try to prevent this by giving blood thinners, but too much raises bleeding risk. This study asks a deceptively simple question with big practical consequences: can we reliably measure and predict how much these fibers clog during routine dialysis?
Peeking inside the filter
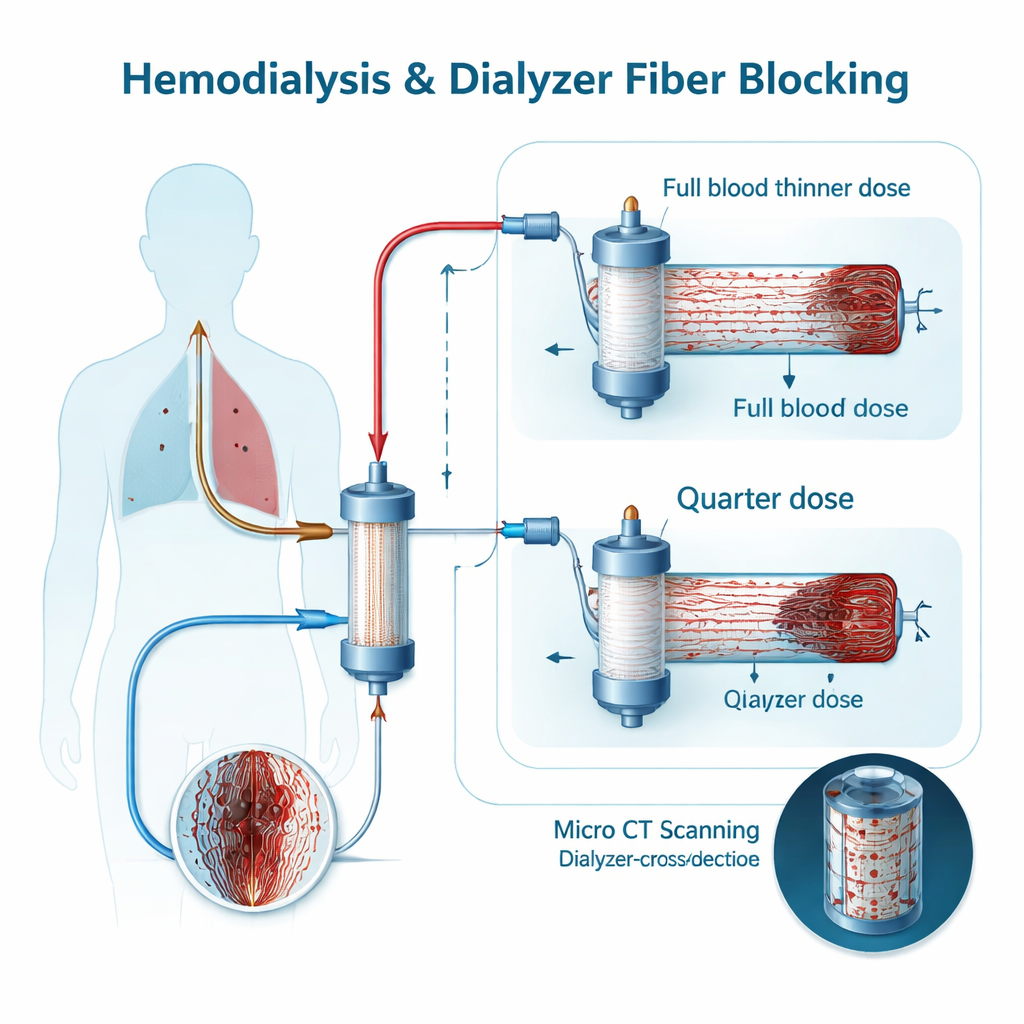
Today, the only truly precise way to see how many fibers are blocked is to scan the used dialyzer with micro‑computed tomography (micro‑CT), a kind of high‑resolution 3‑D X‑ray. It can literally count how many of the roughly 13,000 fibers remain open after a session. That level of detail is excellent for research but too slow and complex for everyday care. In clinics, nurses instead rely on a quick visual score of how “red” the filter looks and on its final dry weight, both of which are rough stand‑ins for clotting. The researchers wanted to know how much these different measures fluctuate from one treatment to the next in the same person, and whether a sophisticated blood test could offer a simpler, earlier warning.
Testing less versus more blood thinner
The team studied ten stable dialysis patients over two weeks. Each person had three sessions with their usual dose of a low‑molecular‑weight heparin blood thinner and three sessions with only a quarter of that dose, in randomized order. After every treatment, the dialyzer was rinsed, dried, weighed, visually scored by two independent observers, and scanned by micro‑CT to calculate the percentage of open fibers. As expected, using only a quarter of the normal blood thinner led to more clogged filters: visual scores were worse, dialyzers weighed more, and micro‑CT showed a drop in open fibers from a median of about 94% to 74%. So the methods clearly distinguished “more” from “less” clotting overall.
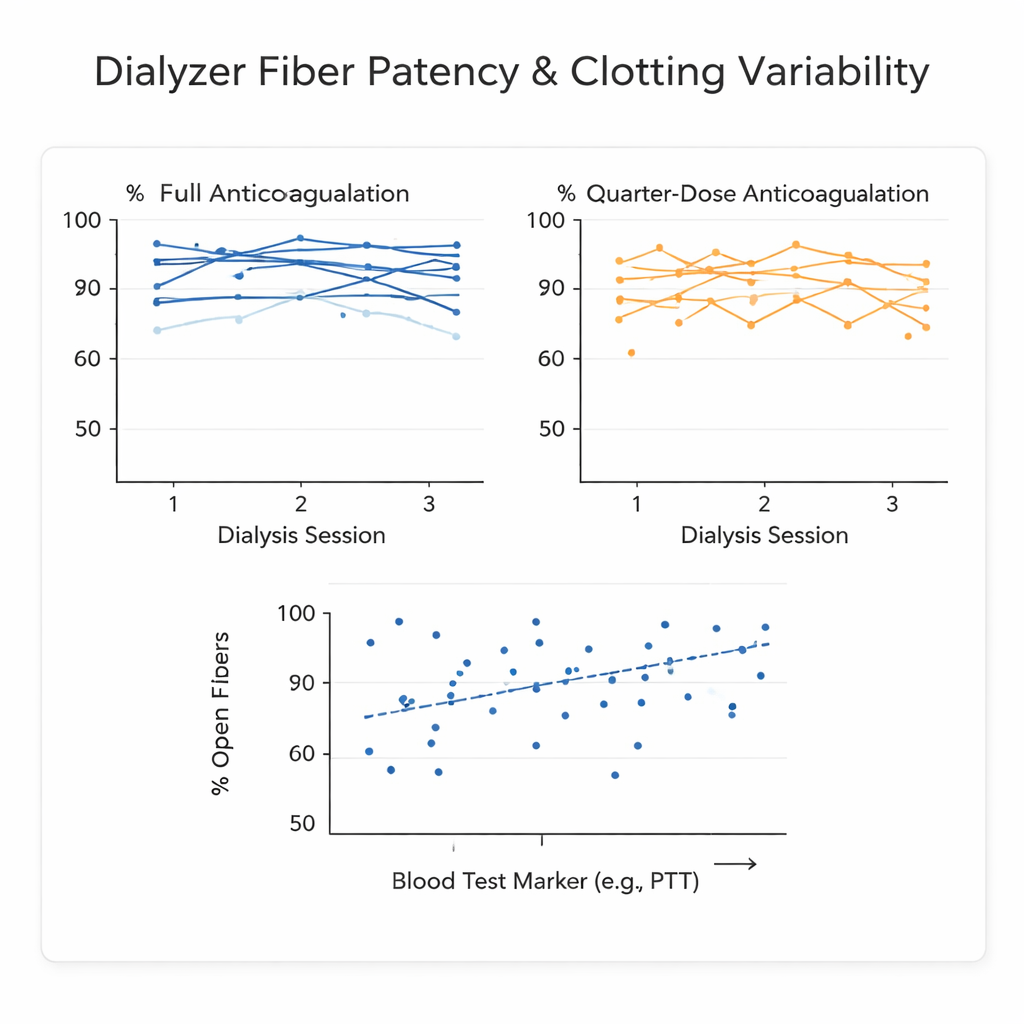
High day‑to‑day swing in the same patient
A key finding was how much the results jumped around from one session to another in the same individual, even under the same blood‑thinner dose. The statistical measure used, called the intraclass correlation coefficient, stayed around 0.5 for dialyzer mass and for the fraction of open fibers on micro‑CT—well below the commonly desired 0.7 threshold. In simple terms, the natural day‑to‑day changes within a patient were almost as large as the differences between patients. That swing is probably driven by biological factors such as low‑grade infections, inflammation, or subtle changes in the vascular access, rather than by any inaccuracy of the scanning technique itself.
Why a promising blood test falls short
The researchers also tested a whole‑blood “thrombin generation” assay, which tracks how quickly and how strongly blood forms thrombin, a central clotting enzyme. Because it includes platelets and red blood cells, it is thought to capture the body’s overall clotting tendency better than classic lab tests like clotting times. Several parameters were measured before and after each dialysis session. Two time‑related measures—the delay before clotting ramps up and the time to reach peak thrombin—showed moderate correlations with how open the fibers were at the end, but only when taken after dialysis. However, the scatter in the data was large: many sessions with similar blood‑test values ended with quite different degrees of fiber blocking. That means these tests cannot reliably predict, for a given patient on a given day, whether their dialyzer will clot badly.
What this means for patients and researchers
For patients and clinicians, the take‑home message is both reassuring and cautionary. Stronger blood thinning does, on average, keep the dialyzer more open, but the amount of clotting can vary widely from one session to the next in the same person. A single scan, weight, or visual impression of a used filter is therefore a noisy snapshot, not a stable fingerprint. Researchers designing future studies on clotting in dialysis must account for this high within‑patient variability when choosing sample sizes and interpreting results. And while advanced blood tests of clotting behavior are intriguing, they are not yet accurate enough to guide day‑to‑day decisions about how much blood thinner an individual patient needs.
Citation: Eloot, S., Mertens, T., Josipovic, I. et al. Predicting dialyzer fiber blocking is hard due to high intrapatient variability and limited utility of thrombin generation markers. Sci Rep 16, 5913 (2026). https://doi.org/10.1038/s41598-026-36507-0
Keywords: hemodialysis, dialyzer clotting, anticoagulation, thrombin generation, micro-CT imaging