Clear Sky Science · en
A principal component entropy metric for assessing global synchronicity in EEG signals
Why brainwave harmony matters
Every moment, your brain is alive with waves of electrical activity. Doctors can record these waves with a test called electroencephalography (EEG), but turning the tangled lines on the screen into clear, objective measures of brain health is still a challenge. This study introduces a new way to read those waves—called PC-entropy—that aims to capture, in a single number, how much different parts of the brain are “playing together in sync” or “doing their own thing.” That simple score could help track sleep, seizures, recovery from coma, and mental effort during difficult tasks.
From many brain signals to one simple score
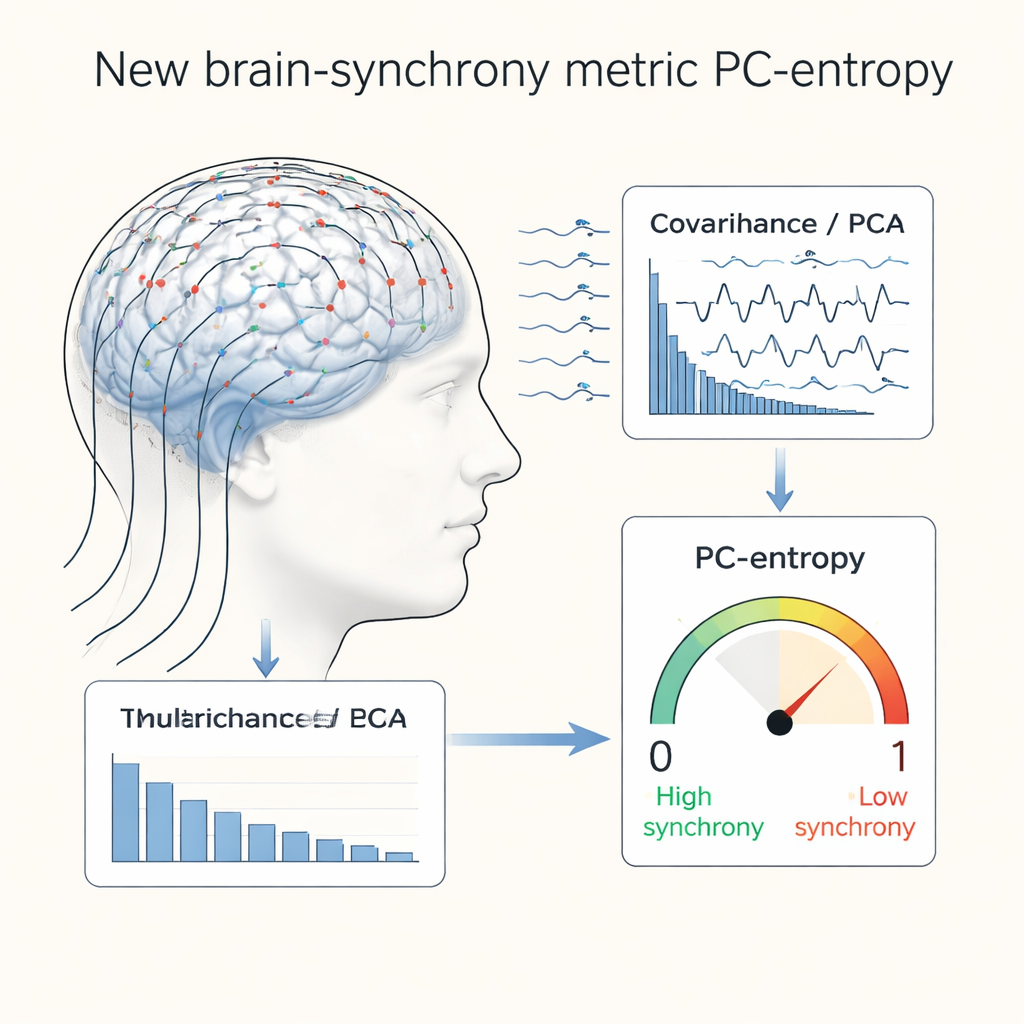
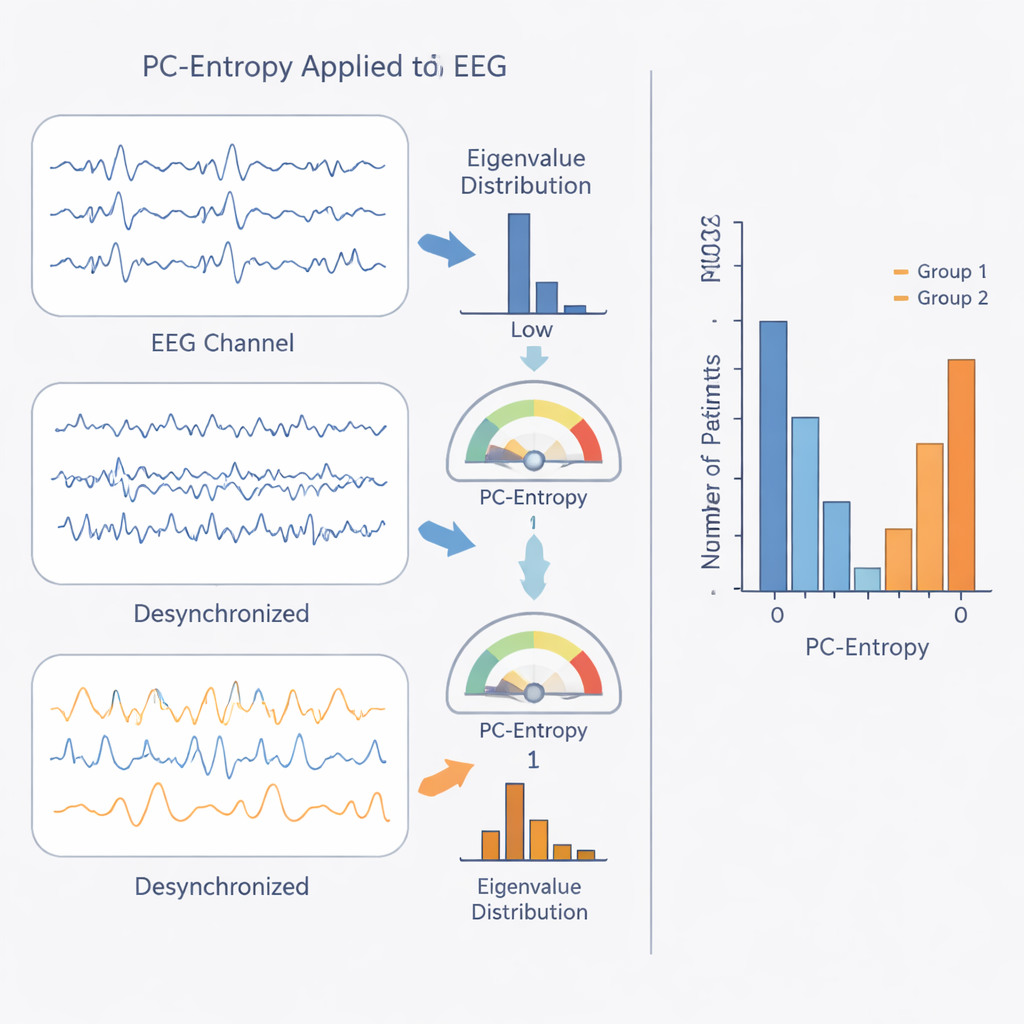
Traditional EEG analysis often looks at pairs of electrodes at a time, asking how tightly each pair is linked. That is a bit like judging an orchestra by listening to only two instruments at once. The new PC-entropy approach instead listens to the whole ensemble. It starts by using a standard mathematical tool (principal component analysis) to find the main patterns shared across all EEG channels and how much of the overall signal each pattern explains. These contributions are then treated like a probability distribution and fed into an information measure (entropy) that describes how spread out or concentrated they are. If most of the activity is captured by a single shared pattern, PC-entropy is near 0, meaning strong global synchrony; if the activity is more evenly split among many patterns, the value moves toward 1, meaning the channels are behaving more independently.
Testing the method on virtual brain rhythms
Before applying PC-entropy to real patients, the researchers checked whether it behaves sensibly in a well-known computer model of coupled oscillators, often used as a stand-in for synchronized brain cells. By gradually increasing how strongly the oscillators were connected, they could drive the system from disorder toward lockstep behavior. PC-entropy reliably fell as synchrony increased, across different sampling rates and time-window lengths, confirming that it tracks the expected shift from chaos to coherence. Importantly, when they changed the number of simulated channels, the normalized PC-entropy stayed comparable, meaning the measure can be used fairly across EEG systems with different numbers of electrodes or when some channels are lost during recording.
What the metric reveals in real sleep and disease
The team then applied PC-entropy to several large, publicly available EEG datasets. In overnight sleep recordings, the measure showed that brain synchrony waxes and wanes over tens of minutes, forming stretches of relatively stable coordination separated by more abrupt changes. These patterns only loosely matched standard sleep stages scored by human experts, suggesting PC-entropy is capturing a different aspect of brain organization than the usual labels such as REM or deep sleep. When they compared healthy sleepers to people with nocturnal frontal lobe epilepsy, the new metric highlighted distinct signatures: patients showed altered global synchrony in specific frequency bands and brain regions during various sleep stages, pointing to disrupted network coordination that conventional stage scoring can miss.
Insights into coma recovery and mental effort
PC-entropy also proved informative in patients who were comatose after cardiac arrest. Roughly 18 hours after circulation was restored, patients who later recovered good brain function tended to show higher PC-entropy values—meaning less rigid, more differentiated activity across brain regions—than those with poor outcomes. This fits with the idea that richer, more complex brain dynamics go hand in hand with consciousness and recovery. In a separate dataset of healthy volunteers performing mental arithmetic, PC-entropy increased in certain frequency bands, especially over frontal areas, when people engaged in demanding calculations. The changes were strongest in participants who performed the tasks well, indicating that the measure can detect how the brain reorganizes itself when shifting from rest into focused problem solving.
What this means for everyday brain health
In practical terms, PC-entropy offers clinicians and researchers a compact “thermometer” of whole-brain coordination, derived from standard EEG recordings. Rather than sifting through many pairwise comparisons between channels, they can follow a single, normalized score over time or compare it across people and conditions. While the method still has limitations—such as sensitivity to volume conduction and its reliance on mostly linear relationships—it opens a path toward faster, more global assessments of brain function. For patients, this could eventually mean more objective tracking of sleep disorders, seizure disorders, coma prognosis, and even cognitive workload, all from the same familiar EEG test.
Citation: Diambra, L., Hutber, A., Drakeford-Hafeez, Z. et al. A principal component entropy metric for assessing global synchronicity in EEG signals. Sci Rep 16, 8031 (2026). https://doi.org/10.1038/s41598-026-36434-0
Keywords: EEG synchrony, brain connectivity, entropy, coma prognosis, sleep and epilepsy