Clear Sky Science · en
A new family of alpha power-G using cosine function with applications and regression modeling
Why new curves can tell better data stories
From how long a light bulb lasts to how long a patient survives after treatment, many real‑world questions boil down to “how long until something happens?” Statisticians describe these patterns with mathematical curves called probability distributions. But the classic curves often struggle to follow messy, real data, especially when failure risks rise, fall, or bend in unexpected ways. This paper introduces a new family of distributions designed to bend more naturally with such complex patterns, without piling on extra parameters or complexity.
Building a smarter curve from familiar pieces
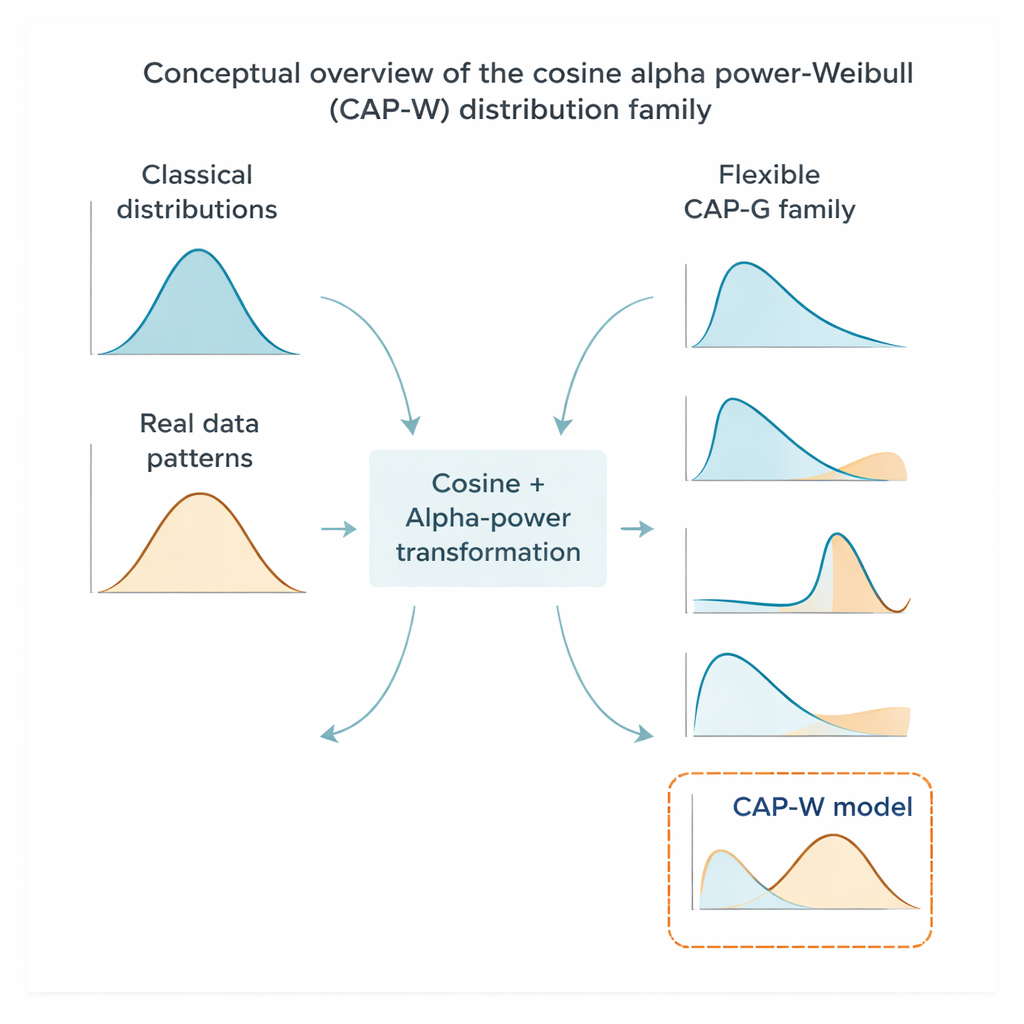
The authors combine two existing ideas to form a more flexible family of distributions. The first ingredient, called the alpha power transformation, lets a statistician tune how asymmetric a curve is and how heavy its tails are—that is, how often very large or very small values occur. The second ingredient is a cosine transformation, a smooth wave-like function that can reshape a curve without adding new parameters. By feeding a standard “baseline” distribution through both steps, they create what they call the cosine alpha power-generated (CAP-G) family. This framework can be applied to many well-known distributions to produce new ones that better match complicated data.
A versatile workhorse for lifetimes and waiting times
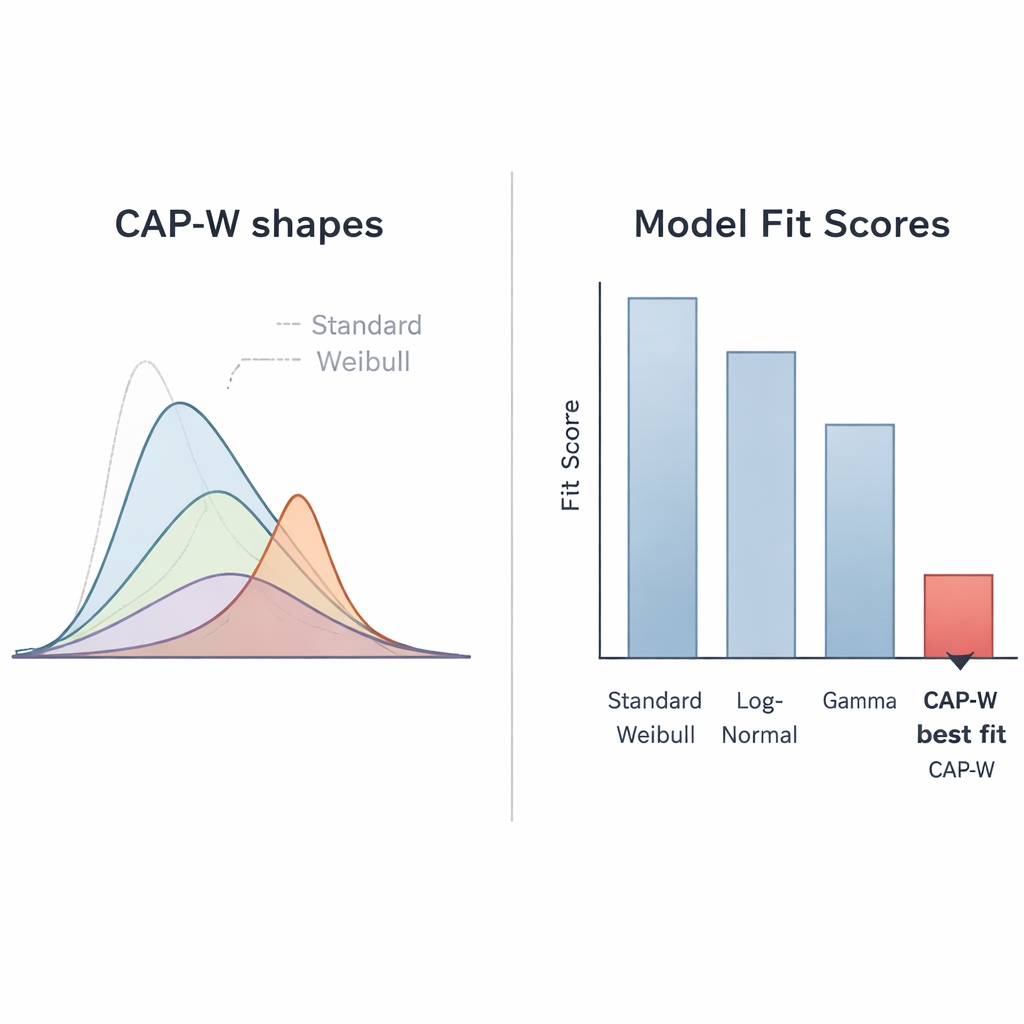
To show the power of their approach, the authors focus on one special member of this family, built from the widely used Weibull distribution. They call it the cosine alpha power-Weibull (CAP-W) model. The Weibull curve is already a favorite in engineering and medicine because it can capture increasing, decreasing, or constant risk over time. CAP-W keeps these strengths but gains even more flexibility: its shapes can be symmetric or strongly skewed, smoothly decreasing or sharply peaked, and it can reproduce a rich variety of hazard patterns, including steadily rising risk, steadily falling risk, “J-shaped” risk that dips and then climbs, and “upside‑down bathtub” risk that rises before easing off. All of this is controlled mainly through a single transformation parameter plus the usual Weibull settings.
Peering under the hood without losing practical focus
Behind the scenes, the authors work out the main mathematical features of the CAP-W curve. They derive formulas for its quantiles (values such as the median or key percentiles), its moments (which describe averages and variability), and measures of tail behavior and uncertainty. They also show how to compute order statistics, which are important when looking at the smallest or largest values in a sample. To estimate the parameters of the model from data, they compare four standard techniques: maximum likelihood, ordinary least squares, weighted least squares, and a minimum-distance method called Cramér–von Mises. Through extensive computer simulations, they find that all four methods become more accurate as sample sizes grow, with maximum likelihood and ordinary least squares generally performing best.
Putting the new model to the test
To check whether CAP-W helps in practice, the authors fit it to four very different real datasets: waiting times for customers in a bank, repair times for communication equipment, survival times for head and neck cancer patients, and failures in aircraft air‑conditioning systems. In each case they compare CAP-W against several competing models that are already considered flexible. Using common measures of goodness of fit, CAP-W consistently comes out on top or very close to it, and graphical checks show that its curves track the observed data especially closely, both in the bulk of the distribution and in the tails.
From distributions to full regression models
The authors then take a further step by embedding their new curve inside a regression framework. By applying a logarithmic transformation to the lifetime and re-expressing the parameters, they build a log CAP-W (LCAP-W) regression model. This lets them relate survival time to patient characteristics in the same spirit as familiar survival models, but with the extra flexibility of the CAP-W shape. Applied to a classic leukemia dataset, the LCAP-W regression fits noticeably better than several advanced rival models, while still supporting standard diagnostic tools such as residual plots to check for outliers and model adequacy.
What this means for real-world data analysis
For a non-specialist, the takeaway is that this work supplies a new, more adaptable family of curves for describing time‑to‑event data—how long until a machine breaks, a customer leaves, or a treatment fails. Because the method reuses well-understood building blocks and does not rely on piling on parameters, it offers both flexibility and interpretability. The CAP-W model in particular can match a wide range of risk patterns that standard models may miss, and its regression version can tie those patterns to meaningful predictors. As data become richer and more complex, such shape‑flexible yet manageable tools can provide clearer, more reliable insights into how and when events unfold.
Citation: Alghamdi, A.S., ALoufi, S.F. A new family of alpha power-G using cosine function with applications and regression modeling. Sci Rep 16, 6617 (2026). https://doi.org/10.1038/s41598-026-36324-5
Keywords: lifetime modeling, Weibull distribution, survival analysis, regression models, probability distributions