Clear Sky Science · en
Innovative application of a traffic-prediction spatio-temporal graph convolutional network for dengue disease forecasting
Why predicting dengue matters to everyday life
Dengue fever is spreading faster than ever, fueled by warmer climates, growing cities, and global travel. Millions of people now live in places where a mosquito bite can mean a serious illness, hospital stay, or even death. Being able to see dengue outbreaks coming a few weeks in advance could give health workers precious time to spray mosquitoes, warn communities, and prepare hospitals. This study explores whether cutting-edge artificial intelligence, originally built to predict traffic jams, can be retooled to forecast dengue waves across Latin America.
Following the trail of dengue across countries
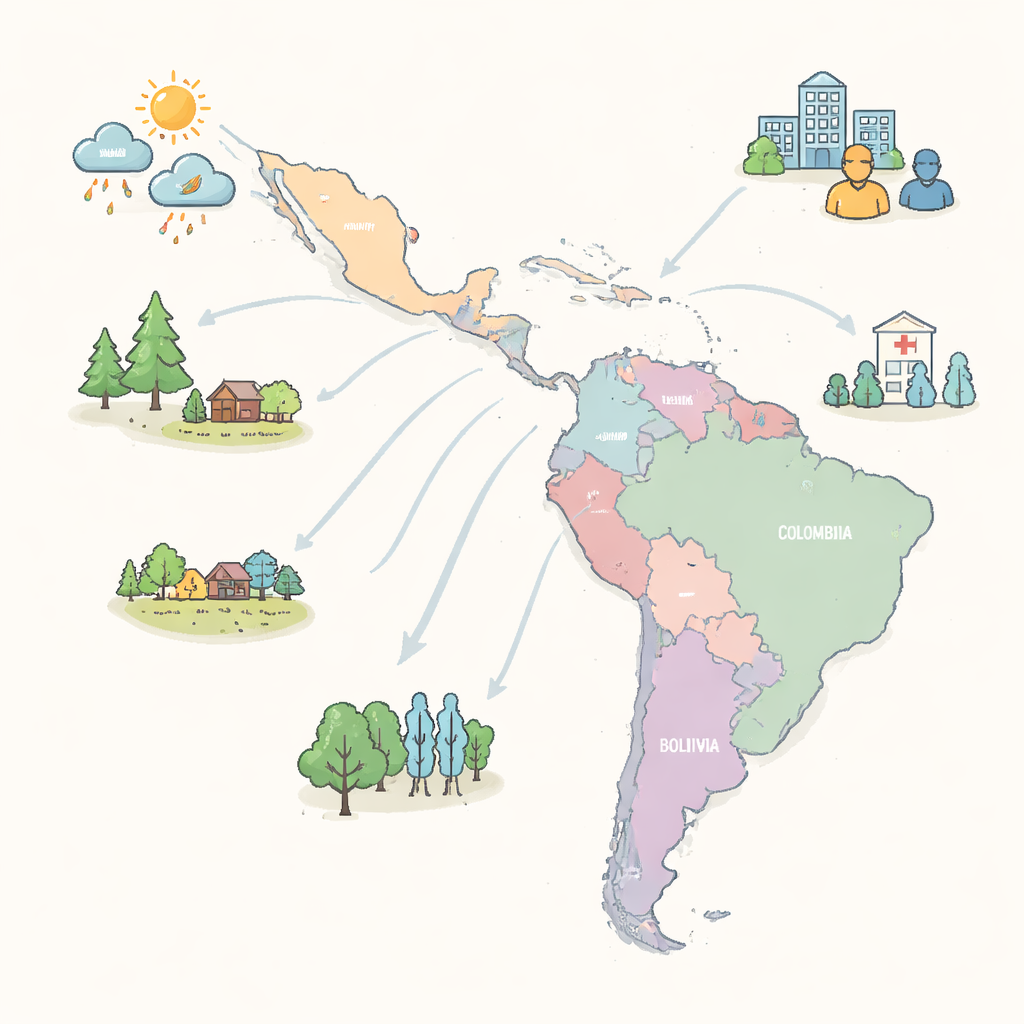
The researchers focused on nine countries in Central and South America, including Brazil, Mexico, Colombia, and several of their neighbors, between 2014 and 2022. Instead of looking only at past dengue case counts and basic weather, they brought together 29 different types of information. These included local dengue reports, weekly weather conditions such as temperature, rain, humidity, and sunlight, environmental details like forest and farmland cover, and a wide range of social and economic indicators. Examples of these are income levels, hospital capacity, vaccination coverage, electricity access, and how populations are distributed across age groups and cities. By combining all these layers, the team aimed to build a more realistic picture of the conditions that allow dengue mosquitoes and viruses to thrive and spread.
Borrowing smart tools from traffic prediction
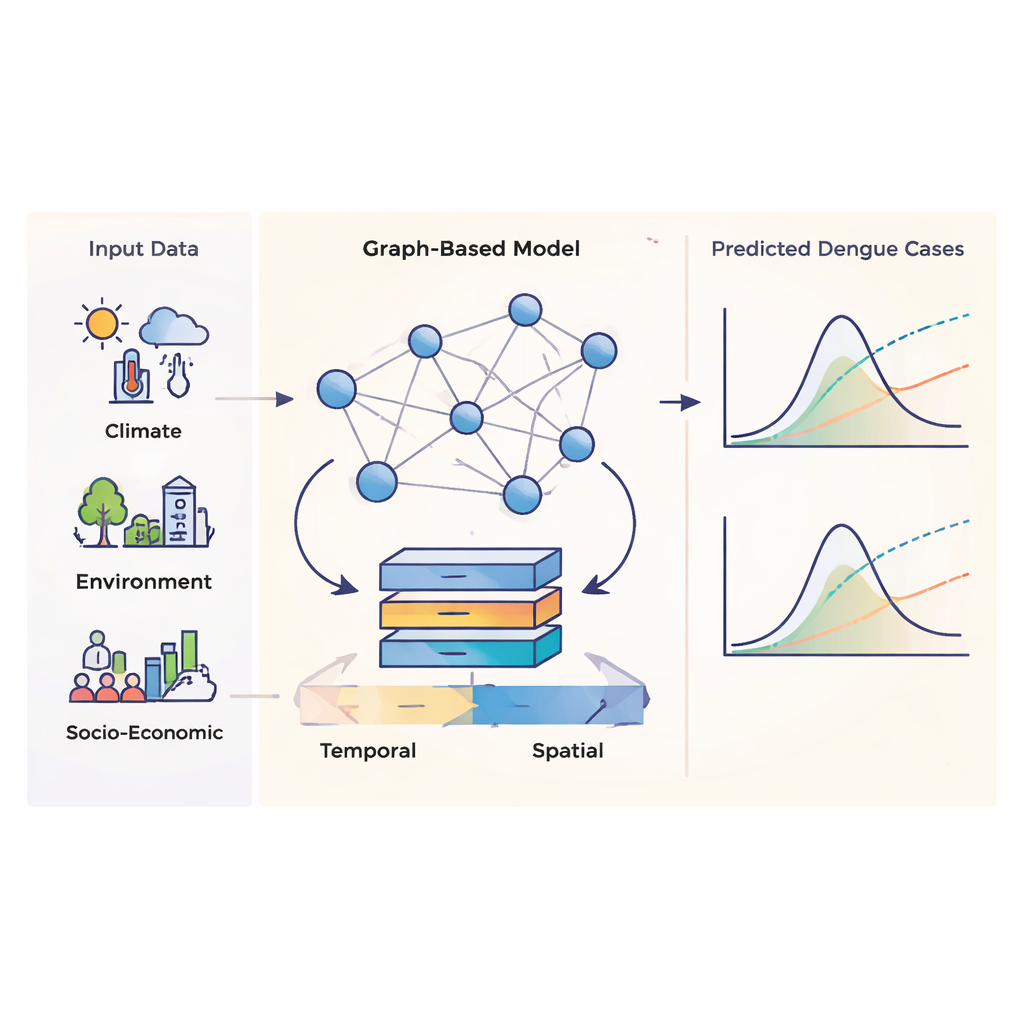
To turn this rich data into forecasts, the team adapted a deep learning method called a Spatio-Temporal Graph Convolutional Network, or STGCN. In plain terms, this model looks at how things change over time (the “temporal” part) and how different places influence one another (the “spatial” part). It treats each country as a “node” in a network and lets the computer learn which countries seem linked in their dengue patterns, instead of hard-coding that only neighboring countries matter. At the same time, it examines how dengue numbers evolve week by week. The authors compared this advanced approach with a more traditional machine learning method called Random Forest, which has already been shown to predict dengue better than many older statistical tools.
How well the new model sees outbreaks coming
Across the nine countries, the STGCN model was especially effective at short-term forecasts, looking one to four weeks into the future. In many cases, it captured the timing and size of dengue surges with high accuracy, reaching very strong statistical scores (R² values often above 0.8 and up to 0.98) and relatively low errors. Brazil, which has large and relatively consistent data, showed the best performance, but countries such as Nicaragua, Honduras, and Mexico also benefited. The model did less well where data were sparse or more irregular, such as in Bolivia and parts of Peru, and like most tools it became less precise as it tried to look further ahead in time. Still, when directly compared, the graph-based model outperformed the Random Forest in most countries and most of the shorter forecast windows.
Why social and economic realities matter
One of the most striking findings was the added value of including social and economic information. When these factors were removed from the model, predictions became noisier and less reliable, particularly in countries such as Honduras, Peru, Colombia, and Mexico. Including indicators related to income, health care, infrastructure, and population structure helped stabilize the forecasts and improved how closely they matched real case counts. This suggests that dengue risk is not just a matter of climate and mosquitoes; it is also shaped by how people live, move, and access services. The study cautions that the model reveals patterns rather than strict cause-and-effect, but it clearly shows that broader living conditions leave a measurable fingerprint on outbreak dynamics.
What this means for public health decisions
For non-specialists, the take-home message is that advanced AI tools can already give health agencies a useful “heads-up” on dengue outbreaks a few weeks in advance, especially when fed with rich data about climate and society. The adapted traffic-forecasting model proved robust, flexible, and generally more accurate than a strong conventional method, making it a promising candidate for early warning systems. While challenges remain—such as uneven data quality, loss of detail within large countries, and reduced accuracy over longer periods—the approach points toward a future in which disease forecasts can be updated regularly, tuned to local realities, and extended to other mosquito-borne threats like Zika or chikungunya. In that sense, this work is a step toward turning complex data streams into actionable time for prevention.
Citation: Siabi, N., Son, R., Thomas, M. et al. Innovative application of a traffic-prediction spatio-temporal graph convolutional network for dengue disease forecasting. Sci Rep 16, 2594 (2026). https://doi.org/10.1038/s41598-026-36225-7
Keywords: dengue forecasting, graph neural networks, climate and health, socio-economic drivers, vector-borne disease