Clear Sky Science · en
Assessment of hydrological drought vulnerability using SPI and SWI indices in Tiruttani block Tamilnadu
Why this water story matters
In many parts of the world, drought no longer means just a few dry months; it can quietly drain rivers, lakes, and even deep groundwater that people rely on every day. This study looks at a rural block called Tiruttani in Tamil Nadu, India, and asks a pressing question: how vulnerable is its water system to long‑lasting drought? By blending rain records, temperature data, and well measurements over 30 years with modern mapping tools, the researchers show how climate shifts and human use are together pushing this semi‑arid region toward serious water stress.
A closer look at a thirsty landscape
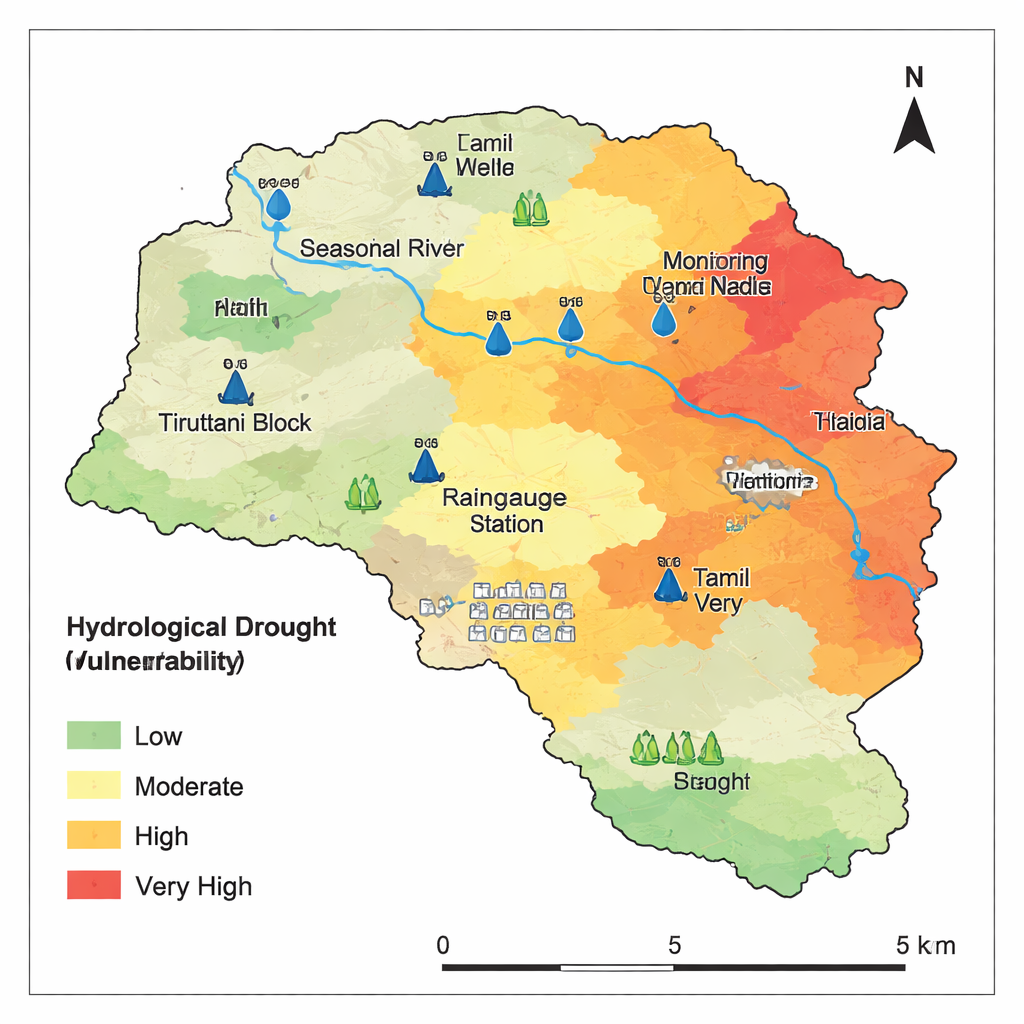
Tiruttani block covers about 186 square kilometers of farms, villages, forests, and scattered tanks (small reservoirs) fed mainly by seasonal monsoon rains and a short river. Summers are hot, with temperatures climbing above 40 °C, and much of the land depends on groundwater pumped from shallow aquifers made of sand, silt, clay, and pockets of hard rock. Over recent decades, farming, towns, and industry have drawn heavily on these underground reserves. Because surface water is limited and rainfall is erratic, any drop in monsoon rain or rise in heat can quickly ripple through crops, wells, and household taps.
Measuring drought from sky to ground
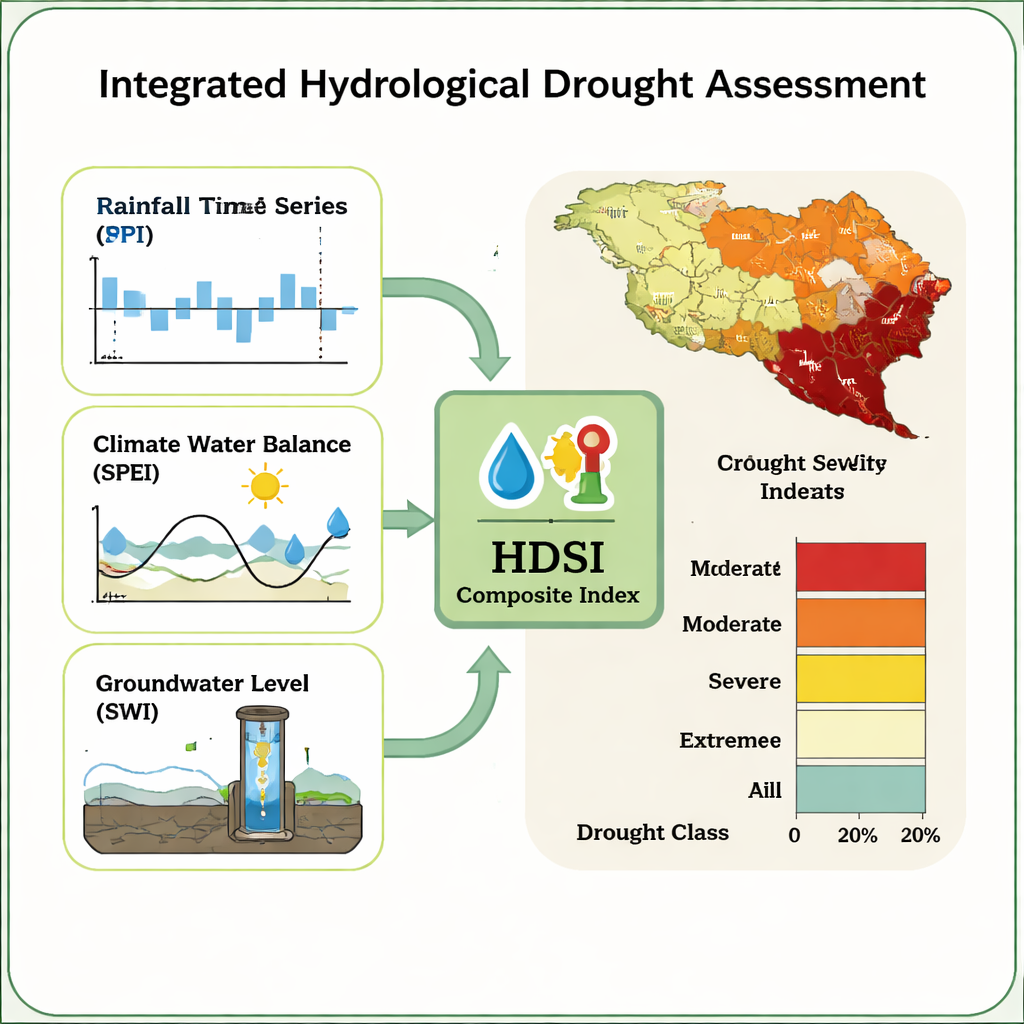
To understand how drought unfolds here, the team combined several types of information from 1995 to 2024. They used rain records from three local gauges together with satellite‑based rainfall estimates, which fill in gaps between stations. From this, they calculated standard measures that compare each month’s rain and climate to the long‑term average. One measure focuses on rainfall alone, while another also accounts for how much water is lost back to the air through heat and evaporation. At the same time, they tracked water levels in ten monitoring wells to see how underground reserves responded to wet and dry spells. All of these data were brought together in a geographic information system, which allowed the scientists to turn numbers into detailed drought maps.
Following the ups and downs of dry years
The records reveal a pattern of repeated mild to moderate droughts punctuated by a few very dry years. Shorter‑term droughts show up when a rainy season fails, stressing crops and soils. Longer‑term measures, which blend many months at once, highlight years when both rainfall deficits and strong heat kept the landscape from recovering. Groundwater told an even more worrying story: early years saw swings between good recharge and decline, but from about 2005 to 2014 many wells slipped into severe or even extreme drought conditions. Even when heavy monsoon years briefly refilled some aquifers, pumping and continued warm conditions meant that deeper reserves did not fully bounce back.
Combining clues into a single drought picture
Because no single number can capture such a complex process, the researchers built a combined score called the Hydrological Drought Severity Index. This index blends rainfall behavior, climate stress, and groundwater levels, then spreads those scores across the landscape using statistical mapping. They also layered in features such as soil type, land use, slope, and how easily the ground can absorb and store water. Areas with hard or shallow soils, steep slopes, dense development, or heavy pumping rose to the top as hot spots of drought vulnerability. The resulting maps show that roughly 72 percent of the Tiruttani block now falls into severe or extreme hydrological drought classes, while only a tiny fraction appears relatively safe.
What the findings mean for people and planning
For residents, the conclusion is stark but clear: in Tiruttani, drought is no longer just a matter of bad monsoon luck. It is the product of shifting climate patterns combined with how people use land and water. Without better rainwater harvesting, careful management of wells, and farming practices that conserve moisture, groundwater levels are likely to keep sliding downward, making households and crops more exposed to every dry spell. On the positive side, the study’s mapping approach offers a practical roadmap. By pinpointing the neighborhoods and villages most at risk, local agencies can prioritize recharge structures, protect natural recharge zones, and adjust irrigation and cropping choices. The same method can be adapted to other semi‑arid regions facing similar pressures, helping communities plan for a drier, more uncertain future.
Citation: Krishnan, D., Partheeban, P., Ramadoss, M. et al. Assessment of hydrological drought vulnerability using SPI and SWI indices in Tiruttani block Tamilnadu. Sci Rep 16, 5795 (2026). https://doi.org/10.1038/s41598-026-36100-5
Keywords: hydrological drought, groundwater, Tamil Nadu, climate variability, water management