Clear Sky Science · en
Integrating random forest-based regression kriging for analyzing spatial variability of rainfall in arid and semi-arid regions
Why mapping rain in dry lands matters
In countries where water is scarce, knowing exactly where and when rain falls can be the difference between food security and crisis. Pakistan spans mountains, deserts, and fertile plains, and its rainfall has grown more erratic under climate change. Yet ground-based weather stations are few and far apart. This study asks a practical question: with limited data, can modern machine learning combined with classic mapping techniques draw sharper, more reliable rainfall maps to guide farming, flood planning, and water management?
Turning scattered rain gauges into full maps
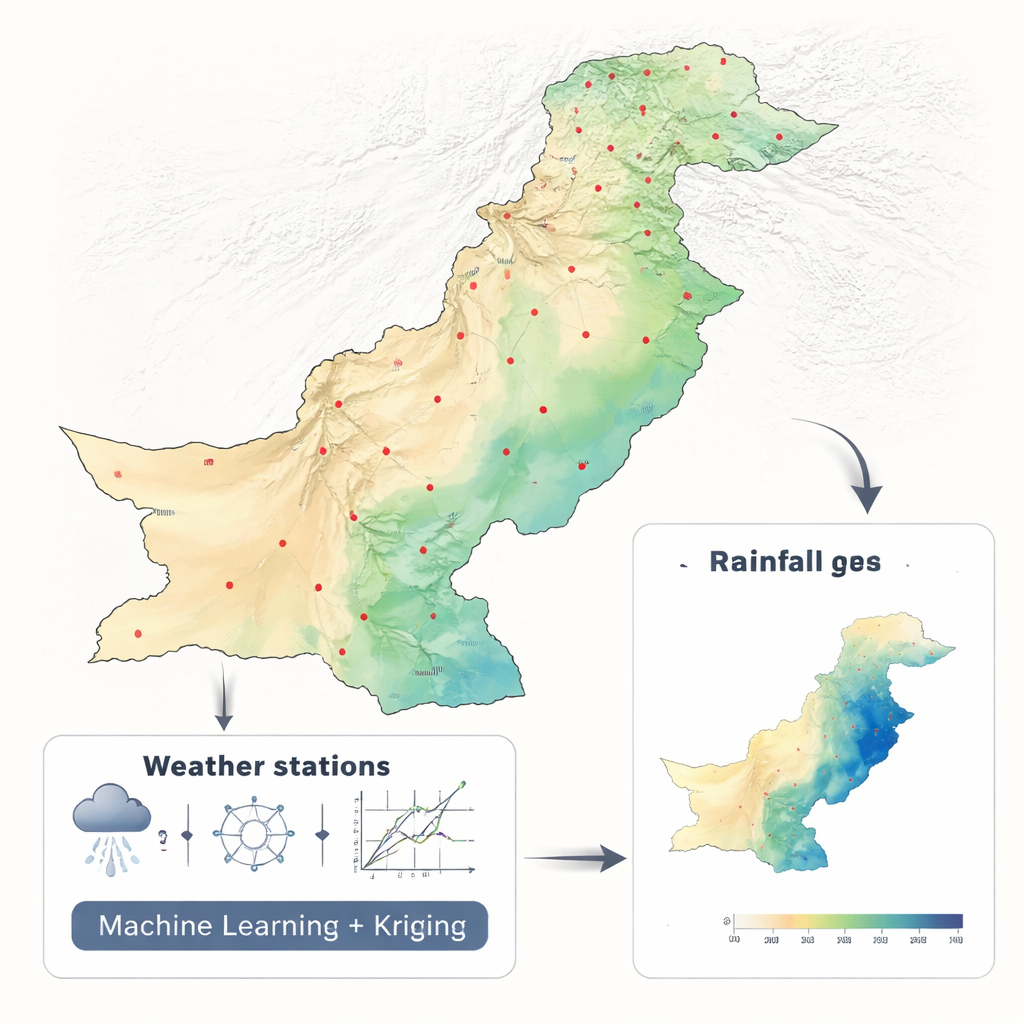
The researchers worked with two decades of monthly rainfall data (2001–2010 and 2011–2021) from 42 stations across Pakistan, using a consistent NASA climate dataset. Instead of feeding dozens of environmental variables into a complex model, they deliberately used only latitude and longitude. This stripped-down design let them focus on one core issue: which mathematical approach best turns scattered point measurements into a continuous map. They compared six machine-learning methods—Random Forest, Support Vector Machine, K-Nearest Neighbors, Neural Network, Elastic Net, and Polynomial Regression—each embedded in a framework called regression kriging that is widely used in geosciences.
Blending big-data style learning with spatial intuition
Regression kriging works in two stages. First, a regression model predicts rainfall at any location from its coordinates, capturing broad patterns such as wetter mountains and drier deserts. Second, a spatial method called kriging fills in the leftover, locally patterned differences between observations and predictions. To make that second step trustworthy, the team first studied how similar or different rainfall was between pairs of stations at various distances—a tool called a variogram. They found that simple “circular” and “linear” mathematical shapes best described how rainfall similarity fades with distance across seasons and between the two decades, a sign of smooth, region-wide rain systems rather than abrupt jumps.
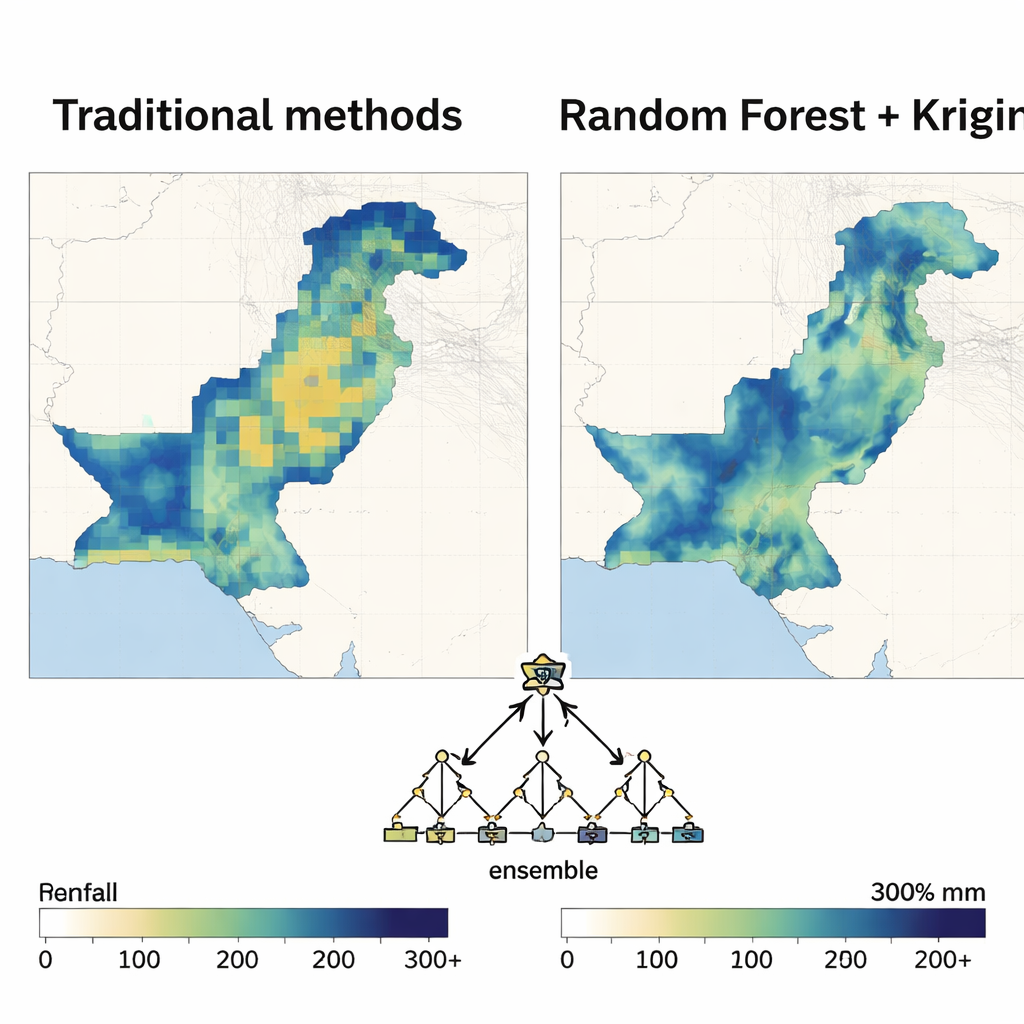
Random Forest emerges as the front-runner
Once the spatial structure was pinned down, each machine-learning method took a turn as the regression engine inside the hybrid model. The authors judged performance with standard yardsticks of error and how much variation in rainfall the model could explain. Across nearly all months and both decades, the Random Forest–based approach gave the most accurate and stable maps. It cut prediction errors far more than polynomial regression and consistently beat support vector machines, neural networks, and other methods, especially during the monsoon months when rainfall is heaviest and most variable. The resulting maps were smooth where they should be, yet still captured sharp contrasts between dry and wet zones, with relatively low uncertainty.
What changing rain patterns reveal
By comparing the two decades, the study also saw signs of shifting rainfall behavior. On average, the later decade (2011–2021) was wetter, with greater month-to-month and place-to-place variability, particularly in spring and during the monsoon. The spatial structure of rainfall became more dispersed, suggesting wider swings in where water is delivered. Importantly, the Random Forest–kriging combination handled both the earlier, somewhat milder climate and the more variable recent period without losing accuracy, hinting that such flexible tools are well suited to a warming, less predictable world.
From maps to decisions on the ground
In everyday terms, the paper shows that smart algorithms can squeeze more value out of limited rainfall records, producing high-resolution maps that are useful even in data-scarce regions. For Pakistan, these maps can support better planning of irrigation, reservoir operations, and flood defenses, and help identify communities most exposed to drought or downpours. The authors stress that their work is a proof of concept focused on the mapping techniques themselves, not yet a full flood or drought warning system. Still, their conclusion is clear: combining ensemble machine learning, led by Random Forest, with geostatistical mapping offers a powerful, practical way to track how rain is changing in dry and semi-dry lands around the world.
Citation: Manaf, M., Ali, Z. & Scholz, M. Integrating random forest-based regression kriging for analyzing spatial variability of rainfall in arid and semi-arid regions. Sci Rep 16, 5298 (2026). https://doi.org/10.1038/s41598-026-36074-4
Keywords: rainfall mapping, random forest, regression kriging, Pakistan climate, water resources