Clear Sky Science · en
Enhancing bioinformatics engineering by utilizing graph therapeutic properties for clinically approved antitoxin drugs in zoonotic diseases
Why this matters for future medicines
Anthrax is often seen as an old farm disease, yet it still threatens livestock, people in developing regions, and even national security because its spores can be weaponized. Treating anthrax relies on a small set of powerful antibiotics and antitoxin drugs. This study asks a deceptively simple question with big implications: can we use ideas from network mathematics—graph theory—to read the shapes of these drugs and quickly predict key physical traits that matter for how they behave in the body? If so, the same approach could speed the search for next‑generation antitoxin medicines.
From deadly spores to drug blueprints
Anthrax is caused by Bacillus anthracis, a bacterium that forms hardy spores and mainly infects grazing animals such as cattle and sheep, but it can also jump to humans. Once inside the body, it can attack the skin, lungs, or gut, leading from flu‑like symptoms to sudden, life‑threatening illness. Doctors currently rely on a limited set of clinically approved drugs—such as ciprofloxacin, penicillin‑based compounds, and several tetracycline‑like antibiotics—to stop the infection and its toxins. Each of these drugs is a three‑dimensional tangle of atoms. The way those atoms are connected governs basic features like molecular weight, how easily a pill dissolves in water, and how it travels through the body. Understanding these links between structure and behavior is essential for safely modifying old drugs or inventing new ones. 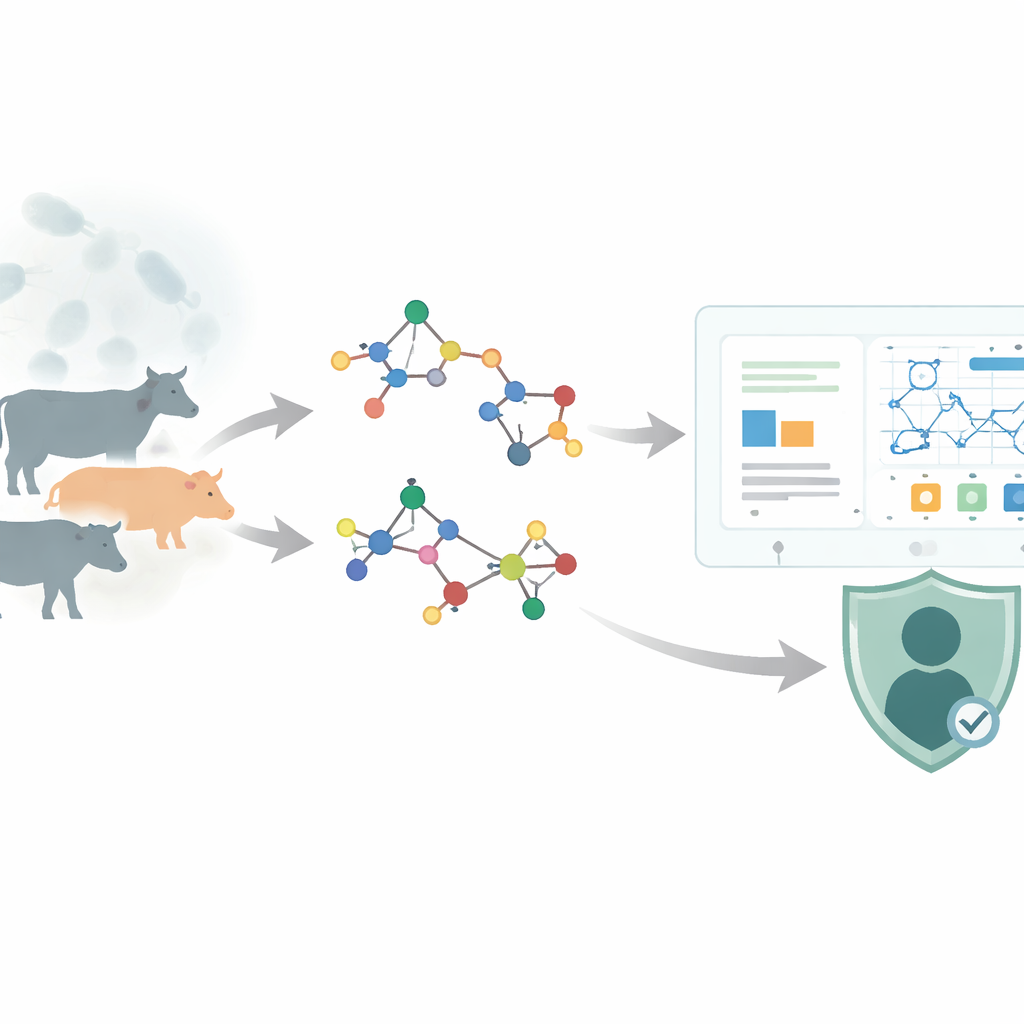
Turning molecules into networks of points and lines
The authors use chemical graph theory, a field that treats a molecule as a network: atoms become points, and bonds become lines. From this network, they compute numerical summaries called topological indices, which capture patterns of branching and connectivity. In this work, they focus on a family of "reverse" indices—variants of classic measures such as Zagreb and atom–bond connectivity indices—and on a compact algebraic object called the M‑polynomial, which encodes how strongly different connection patterns are represented in a drug’s structure. For fourteen approved anthrax‑related drugs, they used Python tools (RDKit and NetworkX) to build the graphs, calculate the M‑polynomials, and derive a panel of reverse indices. They then gathered experimentally measured properties from the PubChem database: melting and boiling points, water solubility, molecular weight, density, and other descriptors that influence how a drug is absorbed, distributed, metabolized, and excreted.
Matching structure patterns to measurable properties
With both sets of numbers in hand—the graph‑based indices and the real‑world properties—the team performed regression analysis, a way of fitting mathematical curves to data. Guided by the shapes of their M‑polynomial surfaces, they tested two families of models: logarithmic curves, which grow quickly and then level off, and cubic curves, which can bend more dramatically. For each index and each property, they assessed how well a given curve explained the data (using the familiar R² statistic) and how stable the prediction remained when data points were systematically left out (using a stricter cross‑validation measure called Q²). 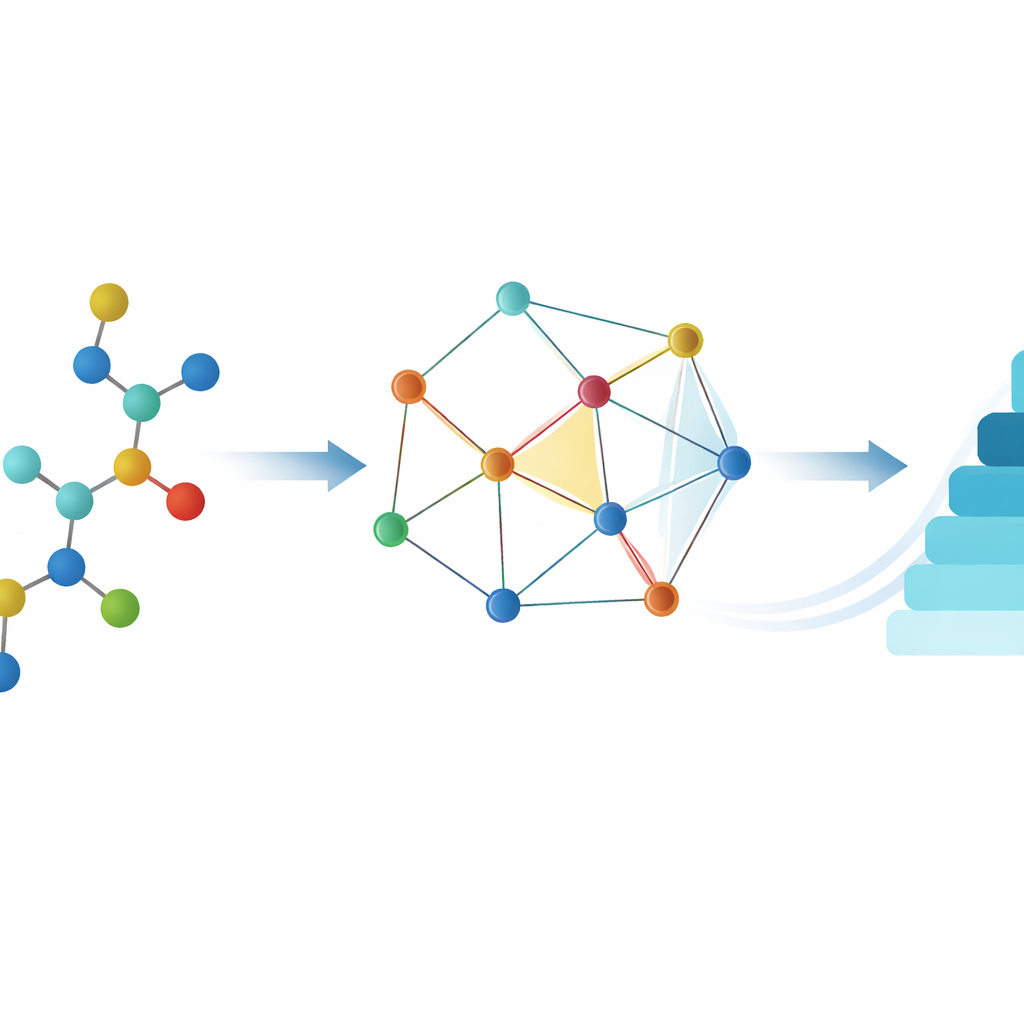
What worked, what failed, and why that matters
The most striking pattern was that not all properties were equally learnable from structure. For thermodynamic traits like melting point or the fat‑loving measure LogP, the reverse indices performed poorly: the models’ R² values stayed low, signaling essentially no predictive power. In contrast, several indices—especially a measure called the Modified Second Zagreb index (mM2) and a reverse atom–bond connectivity index—showed very strong relationships with molecular weight, a fundamental yardstick of molecular size. A simple logarithmic model linking mM2 to molecular weight achieved both high fit and strong cross‑validated predictivity (R² around 0.97 and Q² around 0.99), even after the authors rigorously checked for overfitting and random chance using leave‑one‑out tests, applicability‑domain analysis, and Y‑randomization. More complex cubic models fit the existing data almost too well but failed these stability tests, illustrating how easily small datasets can mislead when over‑complicated formulas are used.
How this helps design better antitoxin drugs
For non‑specialists, the key takeaway is that the authors have built a fast, mathematically grounded way to estimate an anthrax drug’s molecular weight directly from the pattern of its atomic connections—without needing full experimental characterization. Molecular weight is not a measure of how well a drug kills bacteria, but it is a central filter in drug design, tied to how well a compound can be absorbed, distributed, and cleared from the body. By identifying which graph‑based indices reliably track molecular size, and which do not meaningfully predict more subtle traits like melting point or fat solubility, this work sharpens the toolkit for computer‑aided drug design. In future, similar graph‑theoretic models could help researchers quickly screen large libraries of candidate antitoxin molecules, ruling out those whose size or complexity fall outside desirable ranges long before costly lab testing begins.
Citation: Imran, M., Aqib, M., Malik, M.A. et al. Enhancing bioinformatics engineering by utilizing graph therapeutic properties for clinically approved antitoxin drugs in zoonotic diseases. Sci Rep 16, 8590 (2026). https://doi.org/10.1038/s41598-026-36036-w
Keywords: anthrax drugs, chemical graph theory, topological indices, QSPR modeling, molecular weight prediction