Clear Sky Science · en
Reliability-based assessment of road design features and crash risk using a socio-economic index for safety prioritization
Why road design and crash costs matter to everyone
Every time we drive on a rural highway, we quietly trust that the road has been laid out to keep us safe. Yet features that seem harmless—like a gentle curve, a wide lane, or a gravel shoulder—can sharply change the odds and consequences of a crash. This study looks at a long stretch of highway in Iran and asks a very practical question: where should limited safety money be spent first to prevent the most harm, once both human lives and construction costs are taken into account?
Looking at a highway as a system, not just a line on a map
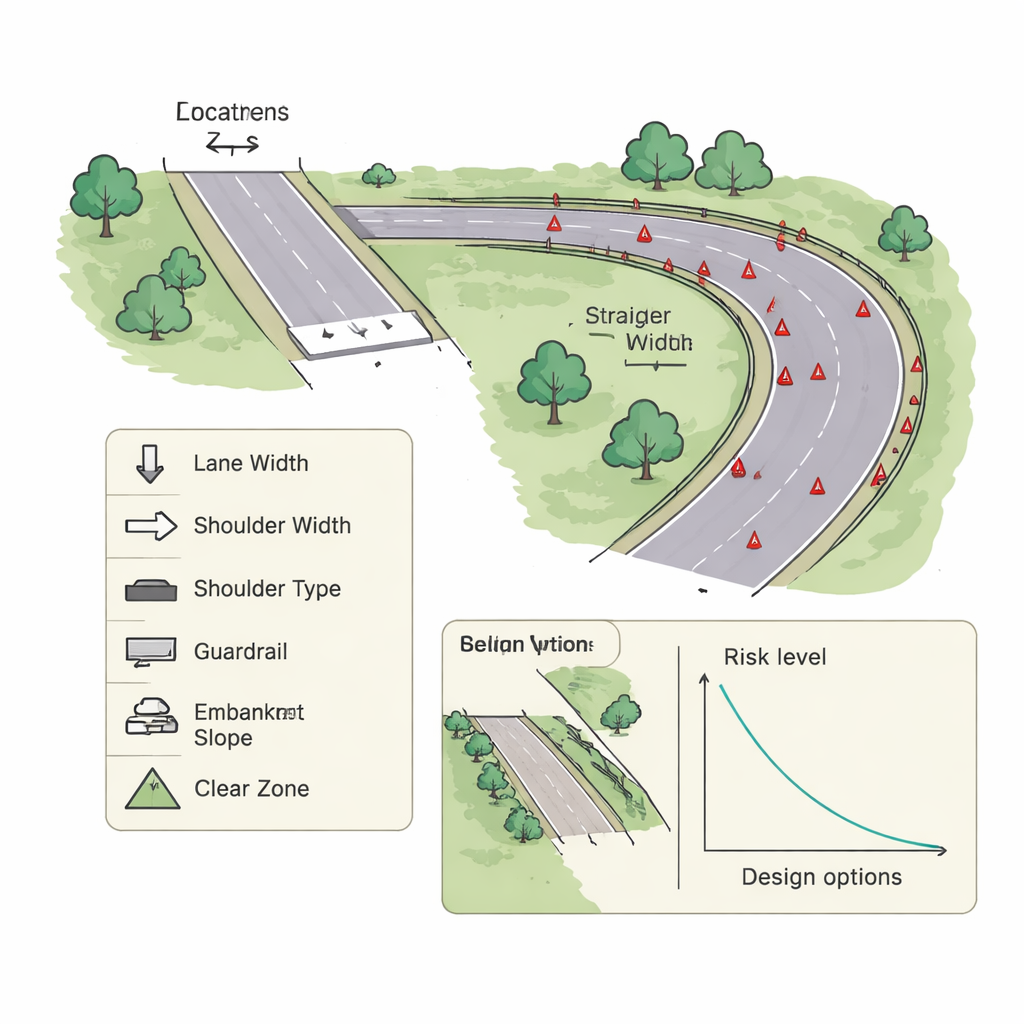
The researchers focused on a 186-kilometer section of Highway No. 36, a two-lane rural road connecting several cities in northeastern Iran. They collected detailed information on the road’s shape—such as whether segments were straight or curved, how steep they were, the width and type of shoulders, lane width, the presence of guardrails, and how much clear space was available at the roadside. They then matched these features with five years of traffic and crash records, including how many crashes happened, how severe they were, and where they occurred.
Putting a price on crashes and comparing it to building costs
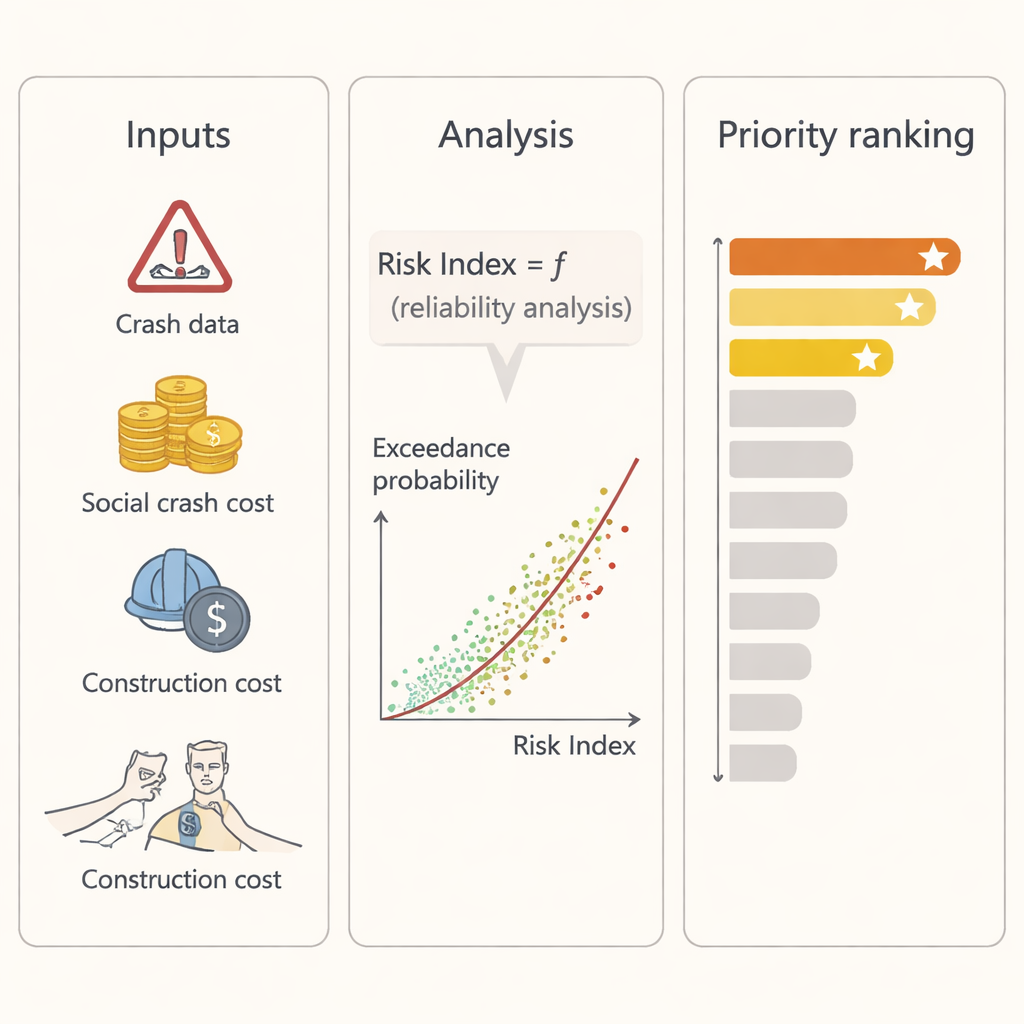
To make fair comparisons, the team turned crash records into a single number that reflects their impact on society. They used widely cited U.S. estimates of the cost of different crash outcomes—from property damage only to fatal injuries—and combined them with statistical methods that balance observed crashes with expected crashes. This produced a “social loss” value for each road segment. They then compared that loss with what it would cost, per kilometer, to build and improve a similar two-lane rural road, based on detailed cost data from the Florida Department of Transportation. The result was a socio-economic risk index: a measure of how much crash damage a segment generates relative to what it costs to construct and upgrade.
Adding probability to the picture: how likely is dangerous risk?
Rather than treating this risk index as a fixed number, the researchers treated it as something that can vary because of uncertainty in the data and in driver behavior. They built what engineers call a reliability framework, where a “limit-state” function marks the boundary between acceptable and unacceptable risk levels. Using Monte Carlo simulation—essentially running thousands of randomized scenarios—they calculated the chance that each segment’s risk index would exceed different thresholds. This created hazard curves that show, for each design feature, how often a segment is likely to cross into dangerously high risk. From these curves, they derived a combined measure: the risk index multiplied by its probability of exceeding the threshold, used to rank segments for safety upgrades.
What the road actually tells us about danger
The patterns that emerged are highly relevant to everyday driving. Horizontal curves—bends in the road—showed the highest crash risk compared with straight segments, echoing the familiar experience that curves are trickier to navigate, especially at speed. Segments longer than 4 kilometers tended to be safer, probably because they offer more continuous, predictable driving. Gentle slopes between 0% and 3% were associated with lower risk, while steeper grades increased it. Surprisingly, wider lanes and wider shoulders often came with higher risk, likely because they invite higher speeds and thus more severe crashes. Gravel shoulders were riskier than asphalt ones, and steep roadside embankments raised the danger if a vehicle left the roadway. Guardrails reduced risk at lower levels but were often found where conditions were already hazardous, leading to mixed results at higher risk levels.
Turning numbers into safer roads
For non-specialists, the key takeaway is that road safety is not just about counting crashes or building more barriers. This study shows how combining crash data, the human and economic cost of injuries, and the price of construction into a single, probabilistic index can reveal which road segments most urgently need attention. In plain terms, it helps answer: “If we fix this curve or shoulder first, how much harm do we actually prevent, and is it worth the money?” The proposed framework offers transportation agencies in Iran and elsewhere a practical, adaptable tool to rank projects, stretch limited budgets further, and redesign rural highways so that fewer trips end in tragedy.
Citation: Saedi, H., Kordani, A.A. & Behnood, H.R. Reliability-based assessment of road design features and crash risk using a socio-economic index for safety prioritization. Sci Rep 16, 6626 (2026). https://doi.org/10.1038/s41598-026-36005-3
Keywords: highway safety, crash risk, road design, rural highways, risk-based prioritization