Clear Sky Science · en
Discrepancies in Arctic-boreal lake area trends driven by sensitivity to dry conditions
Why shrinking and growing northern lakes matter
Across Alaska and northern Canada, lakes dot the frozen landscape like blue beads on a white blanket. These waters are critical for wildlife, local communities, and even the global climate. Yet long-term satellite records disagree on a basic question: are these lakes, taken together, getting bigger or smaller? This article digs into why different space-based maps report opposite trends and shows that the answer lies in how satellites see lakes during dry years, especially along messy, marshy shorelines.
How we watch lakes from space
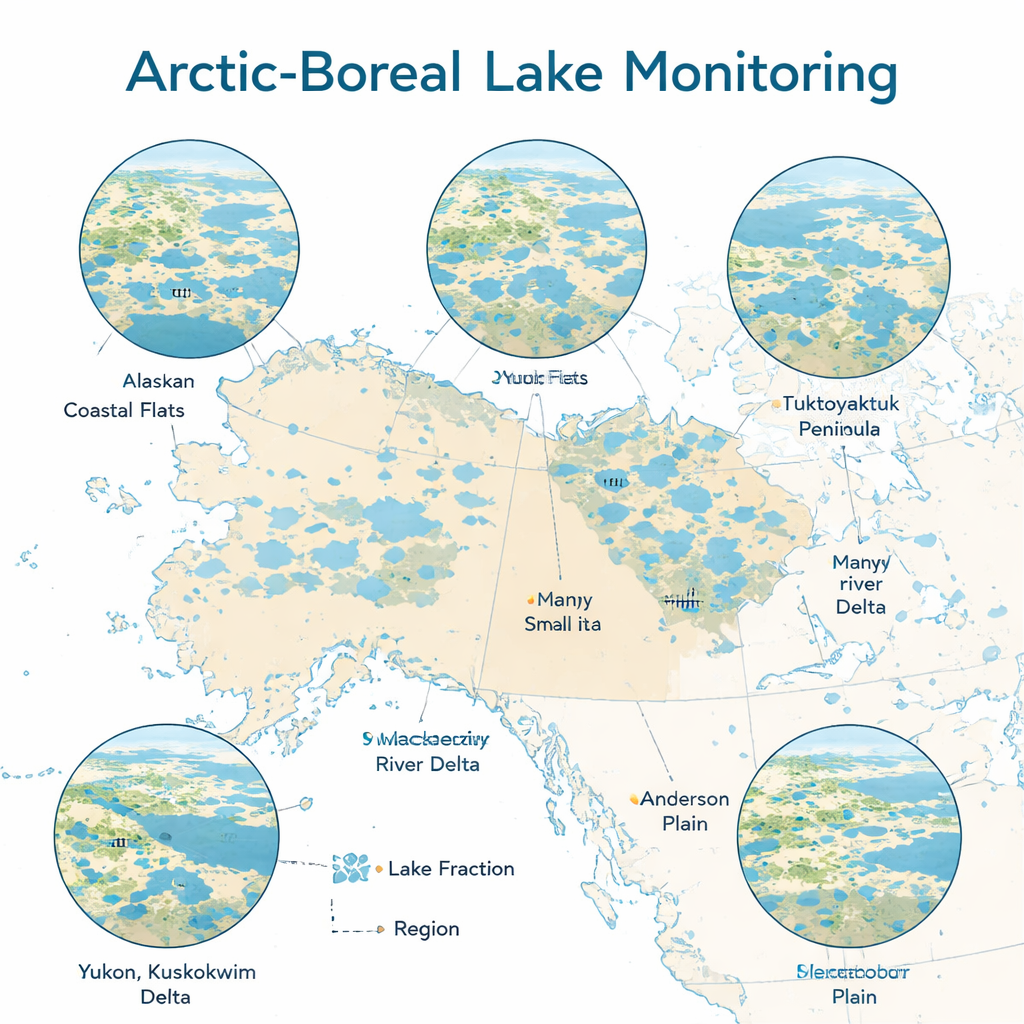
Scientists rely on satellite images to track hundreds of thousands of remote Arctic and boreal lakes that are impossible to visit regularly on the ground. Two of the main workhorses are NASA’s long-running Landsat program and Europe’s newer Sentinel-2 mission. Landsat has a record that stretches back to the 1980s but sees the Earth in relatively coarse 30-meter pixels and passes less often. Sentinel-2 only began in 2016 but provides much sharper 10-meter pixels and more frequent views. The authors focused on six lake-rich regions in Alaska and northwestern Canada, building a high-resolution map of nearly one million lakes and then comparing how two popular Landsat-based water datasets and a Sentinel-2-based product measured lake area from 2016 to 2021.
Where the numbers don’t agree
When the three datasets were stacked side by side, they often disagreed on how much of each region was covered by lake water. One Landsat product (GSWO) generally produced total lake areas close to the Sentinel-2 estimates, though it sometimes read too little or too much water depending on the region. The other Landsat product (GLAD) consistently reported more lake area than both GSWO and Sentinel-2, on average about one-quarter higher. Differences were especially large for big lakes, where small errors in tracing the shoreline add up over a wide surface. Even so, when lake size is taken into account, the biggest relative disagreements actually occurred for the many small, shallow lakes that dominate these landscapes.
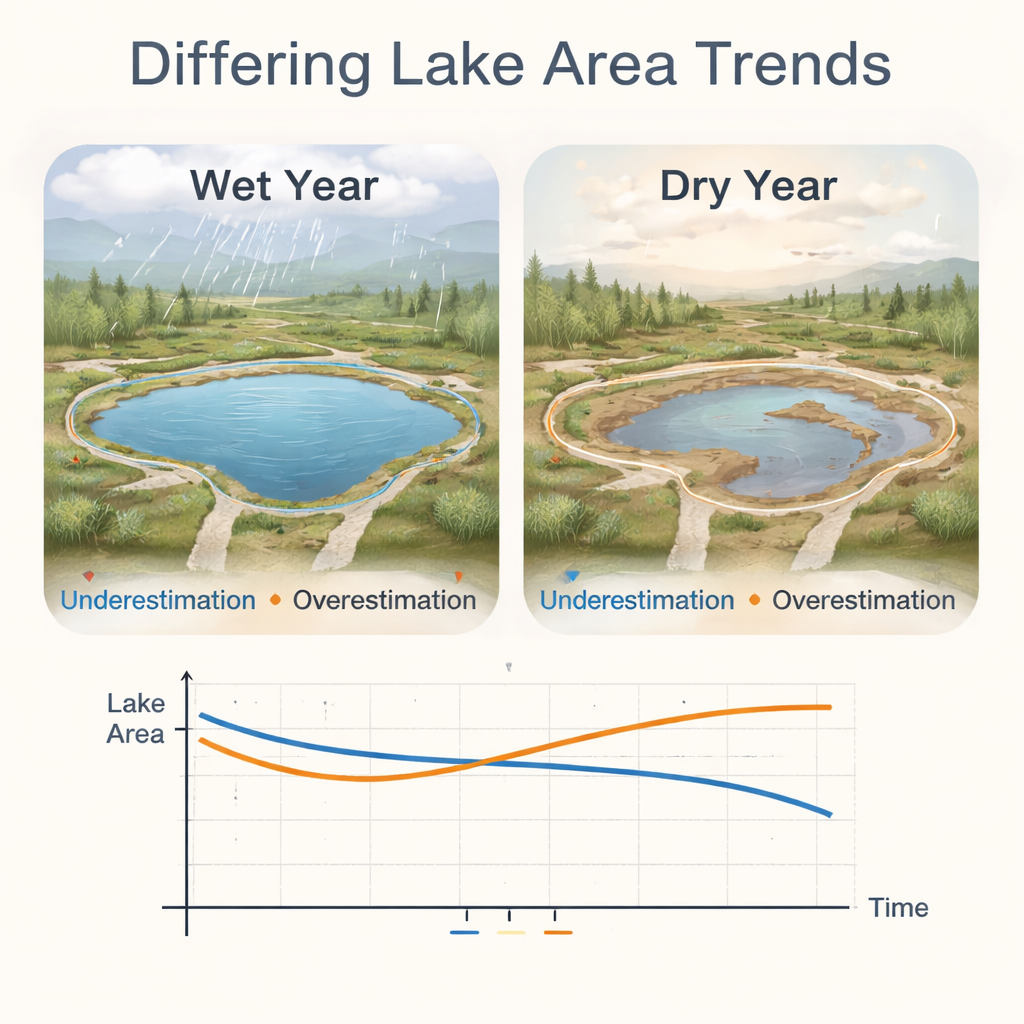
Dry years expose the problem
The most revealing pattern emerged when the team separated relatively wet and dry years. Using Sentinel-2 as their sharpest yardstick, they labeled years with more regional lake area as “wet” and those with less as “dry.” In wet years, all three products traced very similar lake outlines. In dry years, however, the satellite maps diverged sharply. Both Landsat-based products differed more from Sentinel-2 when lakes were at their lowest levels, but in different ways: in some regions GSWO tended to show less water in wet years and slightly more in dry years, while GLAD routinely overestimated lake area and did so most strongly during dry conditions. When these differences were summed across tens of thousands of lakes, they were large enough to flip the sign of short-term trends in some regions, turning an apparent “wetting” into a “drying” or vice versa.
The trouble with fuzzy shorelines
Why should dry years be so confusing from space? The culprit is a belt of “ambiguous pixels” around lake margins. Many northern lakes are shallow and fringed with marshes, sandbars, and aquatic plants. When water levels drop, more of this mixed zone is exposed. From orbit, single pixels may contain a blend of water, mud, and vegetation, and their color can look more like land in some places and more like water in others. Each mapping algorithm draws the line between land and water differently in these mixed areas. The study shows that these subtle choices – how to classify pixels in shallow, plant-filled edges – drive much of the disagreement between products, particularly in regions with many small, vegetation-rich lakes such as the Yukon-Kuskokwim Delta and Yukon Flats.
What this means for reading the long-term record
Because most lake change happens along the shoreline, tiny classification differences in ambiguous pixels can snowball into big disagreements when trends are tracked over decades and across large regions. The authors find that Landsat products tend to smooth out real year-to-year swings in lake area and often weaken the strength of trends compared with Sentinel-2; in several regions, they even suggest the opposite direction of change. This work explains why different studies using different datasets have reported conflicting long-term lake trends in the same Arctic landscapes. It also points to solutions: new methods that better separate shallow water, land, and inundated vegetation, possibly by fusing sharper optical images with future high-resolution radar altimeters like the SWOT mission. Until such tools mature, scientists and decision-makers should treat lake-area trends in regions of small, shallow, vegetated lakes with caution, and place more confidence in trends from areas dominated by larger, deeper, clearer lakes.
Citation: Webb, E.E., Cooley, S.W., Levenson, E. et al. Discrepancies in Arctic-boreal lake area trends driven by sensitivity to dry conditions. Sci Rep 16, 5816 (2026). https://doi.org/10.1038/s41598-026-35981-w
Keywords: Arctic lakes, satellite mapping, climate change, surface water trends, permafrost