Clear Sky Science · en
Spatiotemporal assessment of multi hazard risk using graph based analysis for case studies in India
Why Chain-Reaction Disasters Matter
Mountain communities around the world are facing a new kind of danger: not just single disasters, but chains of events where one hazard sets off another. This article looks at two deadly events in India—a glacial lake flood in the Himalaya and a massive landslide in the Western Ghats—and shows how they unfolded step by step. Using ideas from network science, the researchers map out how intense rain, unstable slopes, dams, rivers, and villages are all linked, and how understanding these links can turn into better early warnings and smarter evacuation plans.
Two Mountain Tragedies, One Bigger Story
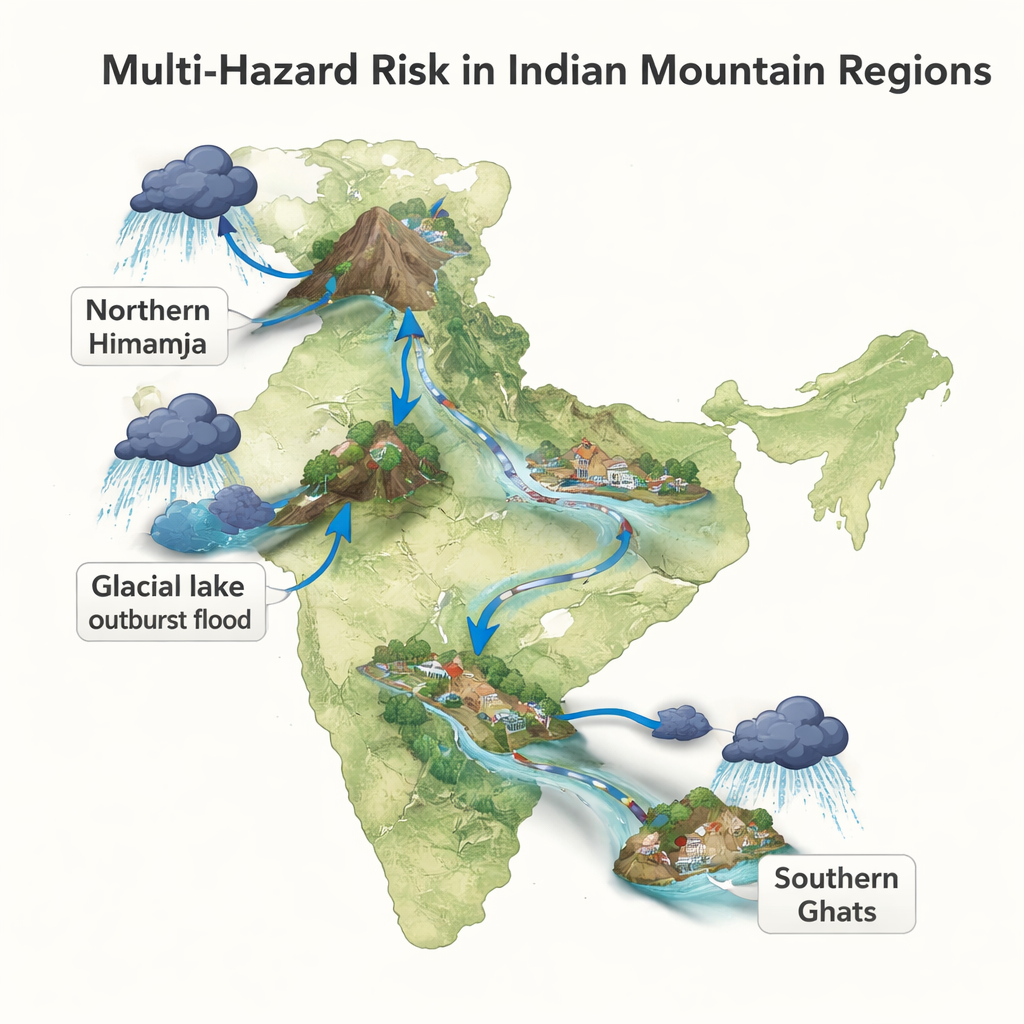
The study focuses on North Sikkim in the eastern Himalaya and Wayanad district in the southern Western Ghats, two very different landscapes that nonetheless faced similar chain-reaction disasters. In October 2023, a glacial lake high above North Sikkim suddenly burst, sending a torrent of water and debris down the valley and damaging a large hydropower dam. In July 2024, after weeks of heavy monsoon rain, hillsides in Wayanad collapsed, unleashing landslides, debris flows, and flash floods that destroyed homes and killed hundreds of people. By comparing these cases, the authors aim to understand not just where hazards occur, but how they interact over space and time.
How Weather Primes the Landscape for Failure
Both disasters began long before the final, dramatic moments that made the news. In Sikkim, years of glacier melt had enlarged a high-altitude lake, slowly increasing the risk that its natural dam of ice and rock could fail. In Wayanad, weeks of intense monsoon rain soaked the soil, weakening steep slopes. The team examined rainfall records using known “thresholds” that link the amount and duration of rain to the likelihood of landslides or floods. They found that in both regions, these thresholds were not just crossed—they were far exceeded, confirming that the environment had been pushed into a highly unstable state well before the main events occurred.
From First Trigger to Cascading Impacts
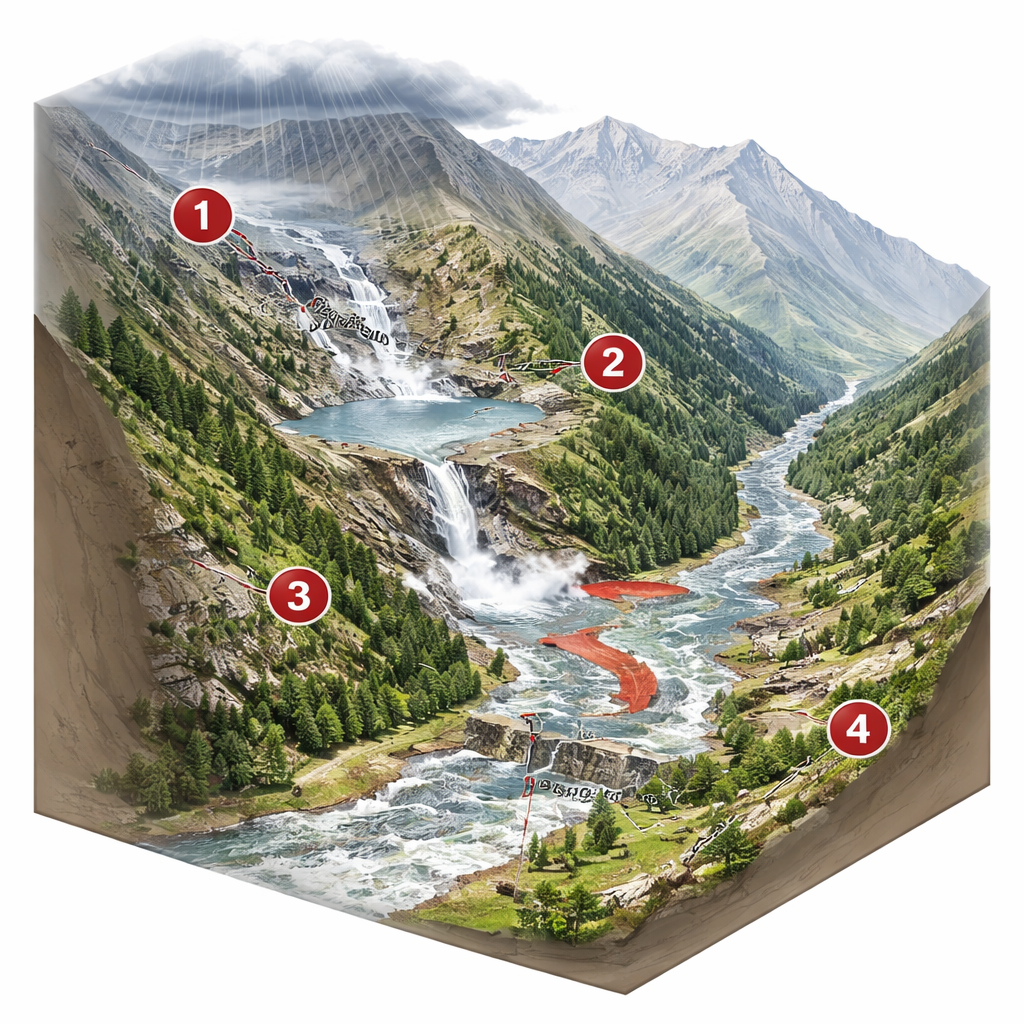
What turned these unstable conditions into full-blown disasters was a series of rapid-fire triggers. In Sikkim, short, intense rainfall combined with an earthquake in neighboring Nepal to destabilize ice above the lake. An ice-and-debris avalanche splashed into the water, overtopped the moraine, and tore it open. The resulting glacial lake outburst flood roared down the valley, damaging roads, bridges, and the large Teesta III dam before continuing downstream and setting off new landslides for days afterward. In Wayanad, extreme rainfall triggered multiple slope failures in small upstream basins. These landslides blocked streams, created temporary dams, and then broke apart, repeatedly sending debris-laden floods into narrow channels and carving out a concentrated zone of destruction over just a few square kilometers.
Seeing Disasters as Networks, Not Isolated Events
To make sense of these complex chains, the researchers turned to graph theory—the same mathematical toolbox used to study social networks or the internet. They treated each type of hazard (such as heavy rain, landslides, floods, or dam failure) as a “node” and each possible link between them as a “connection.” Drawing on field surveys, satellite images, rainfall and river data, government reports, and interviews with residents and officials, they built weighted networks that reflect how often one hazard leads to another and how strongly they are linked. They then used network measures, such as how many connections a hazard has, how often it sits on key pathways, and how far its influence can spread, to compute a risk score for each small sub-basin.
Finding Hotspots and Breaking the Chain
The network view revealed that in Wayanad, a few highly connected hazards—especially landslides and floods—dominate the risk, and that destruction is tightly clustered in densely populated upstream areas. In Sikkim, the chain is longer and more varied: earthquakes, landslides, glacial lake failure, and dam collapse all play important roles, with downstream basins around the hydropower dam emerging as critical “amplifier” zones. By combining the hazard network with information on people, buildings, bridges, and dams, the team could pinpoint sub-basins where cascading failures are most likely and test what would happen if certain links in the chain were weakened or removed. Their results suggest that real-time monitoring of rainfall, glacial lakes, and dam inflows, together with protocols explicitly built around hazard sequences, could help emergency agencies issue phased warnings from upstream to downstream and plan evacuations before the chain of events spins out of control.
What This Means for People Living in Risky Mountains
For non-specialists, the key message is that disasters in mountain regions rarely happen as single, isolated incidents. Instead, they are more like a row of falling dominoes: extreme weather tips one element, which then knocks over the next, and so on. This study shows that by mapping out those dominoes in advance—using a mix of scientific data and local knowledge—authorities can identify the most dangerous links and act earlier, whether by improving monitoring, reinforcing vulnerable dams and bridges, or rehearsing evacuation plans that follow the likely path of a cascading event. In a warming climate where intense rainfall and glacier melt are becoming more common, such network-based thinking could make the difference between a near miss and a major tragedy.
Citation: Ekkirala, H.C., Ramesh, M.V. Spatiotemporal assessment of multi hazard risk using graph based analysis for case studies in India. Sci Rep 16, 5837 (2026). https://doi.org/10.1038/s41598-026-35925-4
Keywords: landslides, glacial lake outburst floods, mountain hazards, early warning systems, disaster risk networks