Clear Sky Science · en
A general framework for adaptive nonparametric dimensionality reduction
Why shrinking big data matters
Modern life runs on data: medical scans, online shopping histories, photos, news feeds, and more. Each record can have hundreds or thousands of measurements, making it hard to store, analyze, or even visualize. Scientists use “dimensionality reduction” to compress this complexity into simpler pictures and models while keeping the important patterns. But today’s popular tools often need many manual choices and trial‑and‑error tweaking. This paper presents a way to let the data itself decide how best to shrink, aiming for clearer pictures, more accurate learning, and less guesswork for the user.
From simple lines to curved realities
A classic tool for simplifying data, Principal Component Analysis, works like shining light on an object and looking at its shadow: it finds the best flat directions that explain most of the variation. This is powerful when the structure of the data is roughly straight or flat. But real data—such as images, texts, or sensor readings—often lie on curved surfaces hidden inside high‑dimensional space. Over the last two decades, new “nonlinear” methods such as Isomap, Locally Linear Embedding (LLE), spectral embedding, and UMAP have been designed specifically to uncover these winding shapes. They rely on local neighborhoods: for each point, they look at its nearest neighbors and try to preserve those small‑scale relationships when drawing a lower‑dimensional picture. However, these methods force the user to choose two key knobs: how many neighbors to use and how many dimensions to project onto. Pick poorly, and the result can be misleading or computationally expensive.
Letting the data choose its own neighborhood
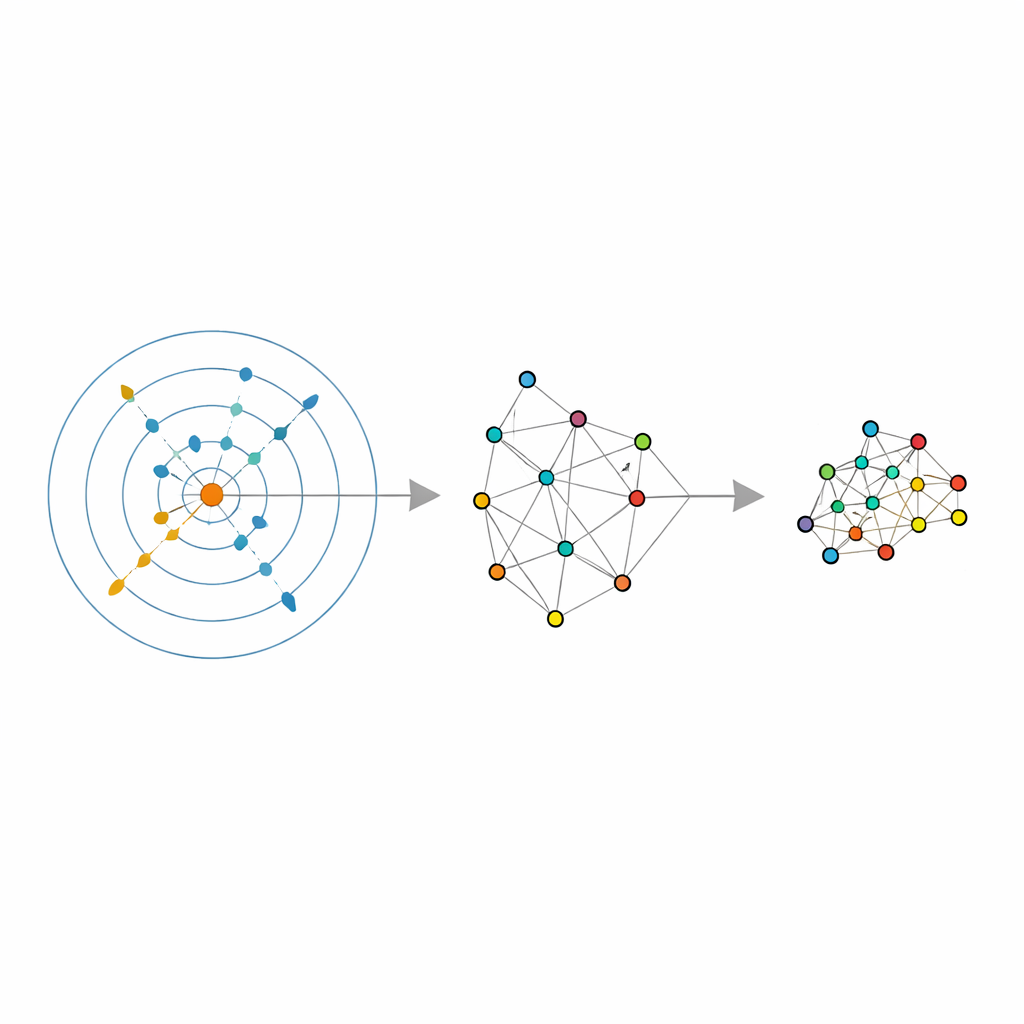
The authors build on a recent statistical tool called an intrinsic dimension estimator, which tries to answer a simple question: how many independent directions does the data truly vary in, once noise is stripped away? Their estimator, called ABIDE, goes further. Around each point, it automatically searches for a neighborhood that looks reasonably uniform—neither too small and noisy nor too large and distorted. In doing so, it returns two pieces of information: a global estimate of the data’s true dimension and a tailored neighborhood size for every point. This turns the usual fixed “number of neighbors” into a locally adaptive quantity that can grow in sparse regions and shrink in crowded ones, matching the actual density of the data.
Turning classic tools into adaptive ones
Armed with these adaptive neighborhoods and the estimated intrinsic dimension, the authors retrofit several popular dimensionality‑reduction and clustering methods. For LLE, they replace the single, user‑chosen neighbor count with the per‑point values returned by ABIDE, and they set the target dimension equal to the estimated intrinsic dimension. The algorithm then learns how to reconstruct each point from a carefully chosen local group before finding a global low‑dimensional arrangement that best preserves these local reconstructions. Similar ideas are applied to spectral clustering—where a graph of similarities among points is used for grouping—and to UMAP, which builds a fuzzy map of how points connect. In each case, the rigid neighborhood size is swapped for a flexible, data‑driven structure that follows the natural geometry of the data.
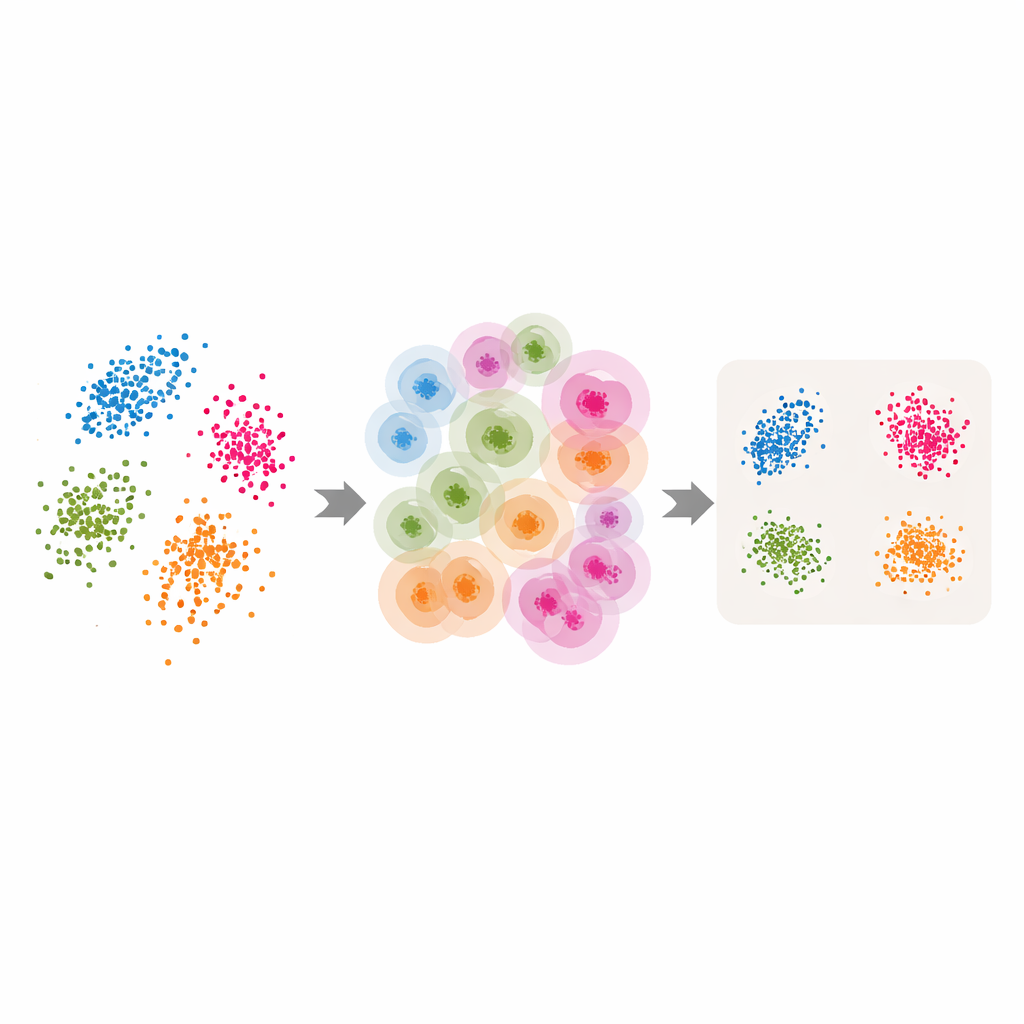
Testing on flowers, digits, text, and synthetic shapes
To see whether this adaptive approach pays off, the authors run experiments on several benchmarks: the classic Iris flower measurements, handwritten digit images (MNIST), news articles represented by language‑model embeddings, and synthetic three‑dimensional shapes with added noise. They compare the adaptive versions against standard software settings and against carefully tuned grids of hyper‑parameters. In unsupervised tasks such as clustering and visualization, the adaptive methods typically yield clearer clusters, tighter groupings, and better scores on standard quality measures. For instance, on complex manifolds with uneven point density, the adaptive methods recover the true structure far better than fixed‑neighbor versions. In supervised tests, where the reduced data are fed into a classifier, the adaptive approach again matches or outperforms the best fixed‑setting choices, without exhaustive tuning.
What this means for everyday data analysis
For non‑experts and practitioners alike, the main message is that shrinking data need not rely on guesswork. By using the data’s own geometry to decide “how many neighbors” and “how many dimensions,” this framework turns widely used tools such as LLE, spectral clustering, and UMAP into smarter, more robust versions of themselves. The result is more trustworthy low‑dimensional views—plots and features that better reflect the true shape of the data—while often reducing the time spent on manual hyper‑parameter searches. In practical terms, this means that tasks such as visualizing large image collections, grouping documents, or preparing inputs for predictive models can become both easier and more reliable, simply by letting the data adaptively guide how it is compressed.
Citation: Di Noia, A., Ravenda, F. & Mira, A. A general framework for adaptive nonparametric dimensionality reduction. Sci Rep 16, 9028 (2026). https://doi.org/10.1038/s41598-026-35847-1
Keywords: dimensionality reduction, manifold learning, nearest neighbors, intrinsic dimension, data visualization