Clear Sky Science · en
Integrated assessment of environmental infrastructural and social risks for urban public safety
Why city safety is more than crime and traffic
When we think about staying safe in a city, we often picture crime, busy roads, or maybe the occasional flood. This study argues that urban safety is really about all of these things happening together: heatwaves and dirty air, aging pipes and roads, and social issues like poverty and crime. By looking at how these factors interact in one fast‑growing city, the research shows how officials can pinpoint danger zones and choose the most effective, fairest fixes.
Many risks, one shared city
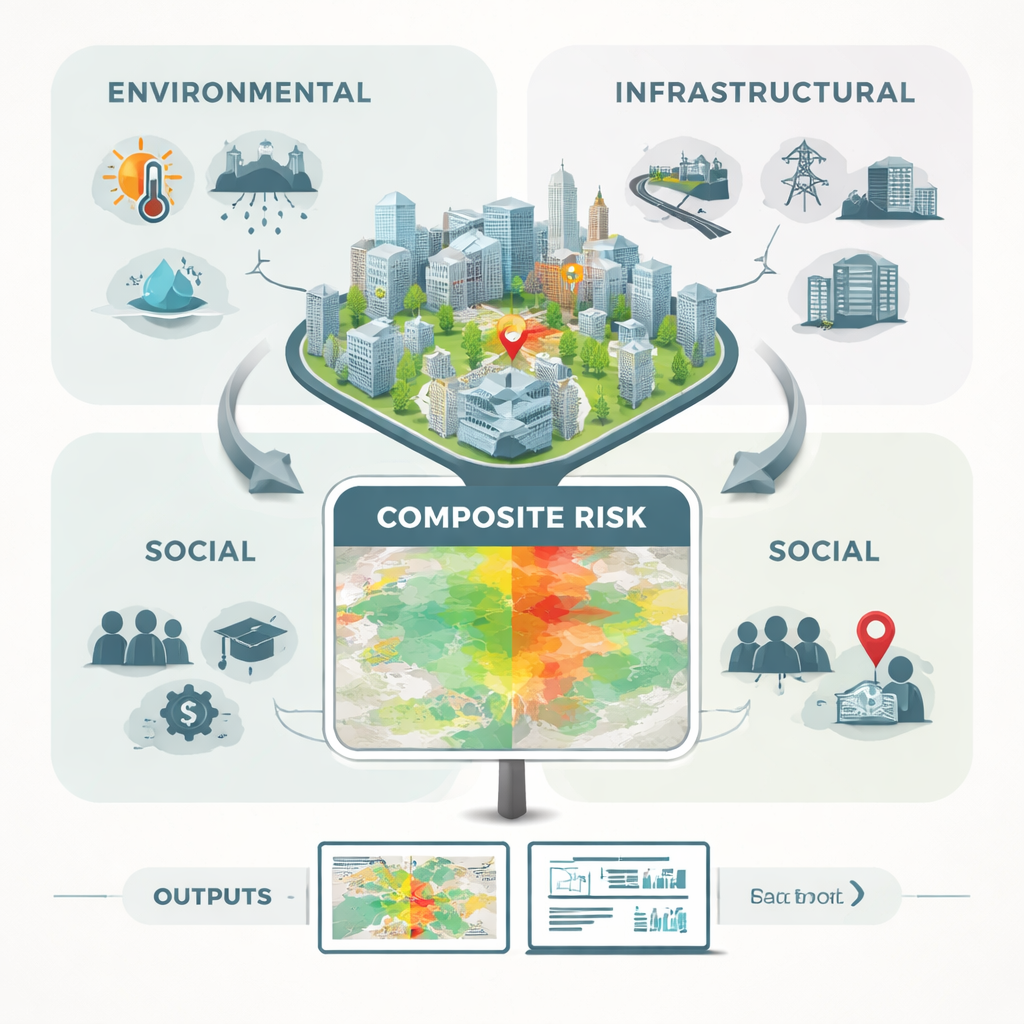
Cities are becoming home to most of the world’s population, which means more people are exposed to overlapping dangers. In Islamabad, Pakistan—the case study for this research—neighborhoods face rising heat, recurring floods, overworked infrastructure, and significant income gaps. The paper treats these not as separate problems but as parts of one system. Environmental risks include hot surfaces, polluted air, heavy rains, and flood‑prone land. Infrastructural risks cover things like old buildings, weak drainage, and overloaded roads and power lines. Social risks focus on who lives where: crowded homes, low incomes, limited education, and crime. The central idea is that when these patterns overlap in the same place, everyday life becomes much less safe.
Turning messy data into clear risk pictures
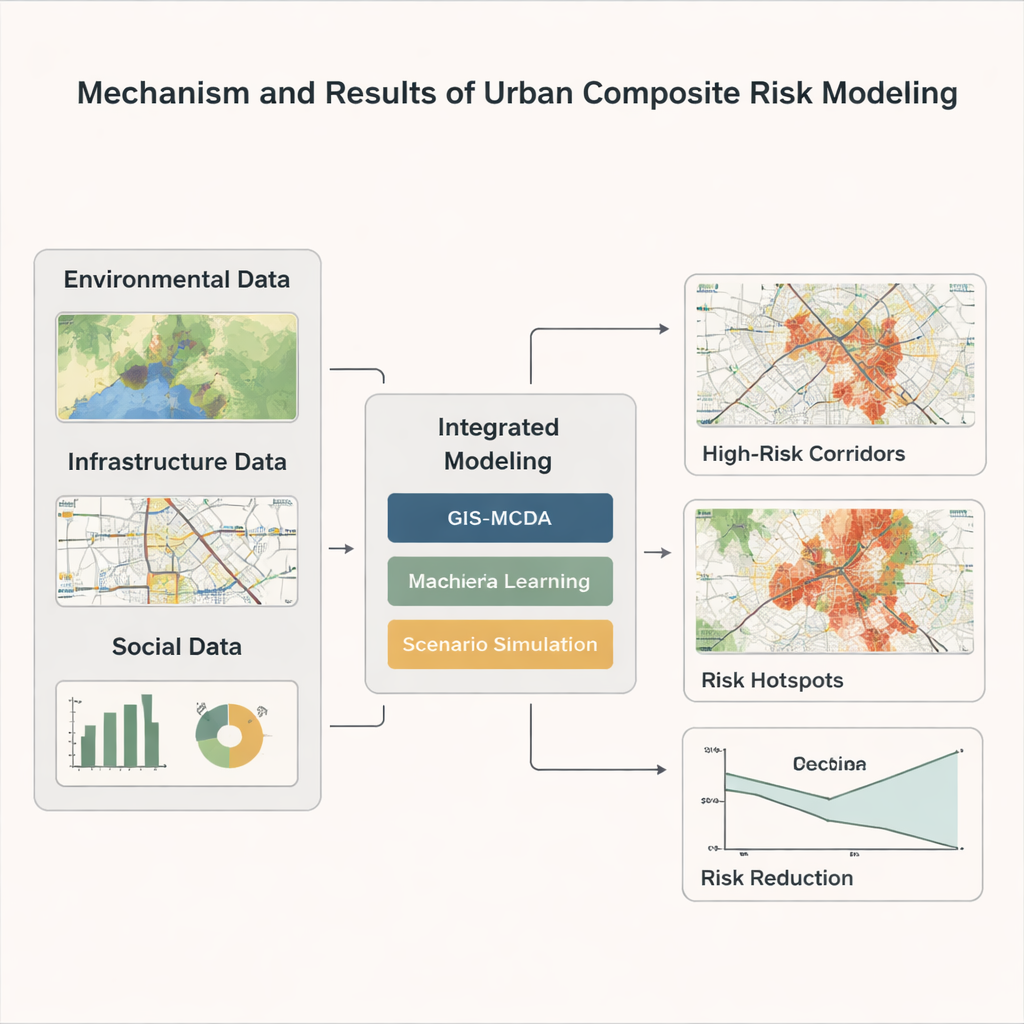
The author assembles a wide array of data: satellite images of land surface temperature, official air‑quality readings, rainfall and flood maps, road and drainage layouts, power‑grid maps, building ages and conditions, census and income statistics, and crime records. All of this information is cleaned, lined up in space and time, and converted to common scales so different layers can be compared. Using geographic information systems (GIS) and a decision‑analysis method, each indicator is given a weight that reflects both expert judgment and how much it actually varies across the city. These weighted layers are blended into a single composite risk index for each neighborhood, showing where environmental, infrastructural, and social weaknesses stack on top of one another.
Where dangers cluster and who is hit hardest
Once the composite index is mapped, clear patterns emerge. Roughly one‑third of the urban area falls into a high‑risk category. River‑side settlements and central transport corridors stand out as hotspots: they combine flood‑prone land, strained drainage, older buildings, traffic congestion, and higher levels of deprivation and crime. In contrast, newer, less dense suburbs with better services tend to be low‑risk. To test how well the model reflects reality, the study trains modern machine‑learning algorithms on years of real incident data—flood reports, heat‑related emergencies, crime, and service disruptions. These models predict high‑risk areas with strong accuracy, suggesting the risk maps are not just theoretical but closely tied to what actually happens on the ground.
What happens if we change the city
The research then asks a practical question: if the city invests in certain improvements, how much safer can people become? Computer simulations test different combinations of interventions. Strengthening drainage substantially lowers flood risk. Planting trees and adding green infrastructure cools hot neighborhoods and modestly improves air quality. Better lighting and targeted policing reduce crime in known hotspots. When these measures are combined—rather than rolled out one by one—the impact is much larger: overall composite risk in the most vulnerable districts falls by about 22–30 percent. The study also tracks who benefits most. Because low‑income areas start from a worse position, they see especially large gains when resources are deliberately steered toward them.
Using data to guide fairer city decisions
For a non‑specialist reader, the key takeaway is that urban safety cannot be fixed with a single tool or in a single department. Heat, floods, failing infrastructure, and social inequality reinforce one another, and only by measuring them together can city leaders see the full picture. This study shows how a city can turn scattered data into clear maps, identify its most exposed neighborhoods, and test which combinations of upgrades give the biggest safety boost per dollar—especially for residents who are usually left behind. In simple terms, the conclusion is that integrated, equity‑minded planning can make cities not just safer overall, but fairer in who gets protected.
Citation: Liu, S. Integrated assessment of environmental infrastructural and social risks for urban public safety. Sci Rep 16, 5909 (2026). https://doi.org/10.1038/s41598-026-35822-w
Keywords: urban public safety, composite risk, GIS and mapping, climate and cities, urban inequality