Clear Sky Science · en
Differentiated allocation of carbon intensity target reduction rates across 332 Chinese cities
Why this matters for everyday life
China is the world’s largest source of carbon dioxide, so how it chooses to cut emissions will strongly influence global climate change. Yet China is not a single, uniform place: megacities like Shanghai face very different pressures than remote forest regions. This study asks a practical question with worldwide relevance: how can a country fairly share carbon-cutting responsibilities among hundreds of very different cities, in a way that is both just and efficient?
Sharing the burden of cutting emissions
The authors focus on “carbon intensity” – how much carbon dioxide is emitted per unit of economic output – rather than total emissions alone. China’s current five-year plan calls for an 18% drop in national carbon intensity between 2020 and 2025. Turning that single national goal into clear targets for 332 cities is tricky. Some cities are rich and innovative, others are poorer or ecologically sensitive. If every city were forced to cut intensity at the same rate, it could slow development in struggling regions or underuse the potential of booming coastal hubs. The study therefore designs a system to distribute reduction targets so that stronger cities do more while vulnerable regions are protected.
What the researchers measured about cities
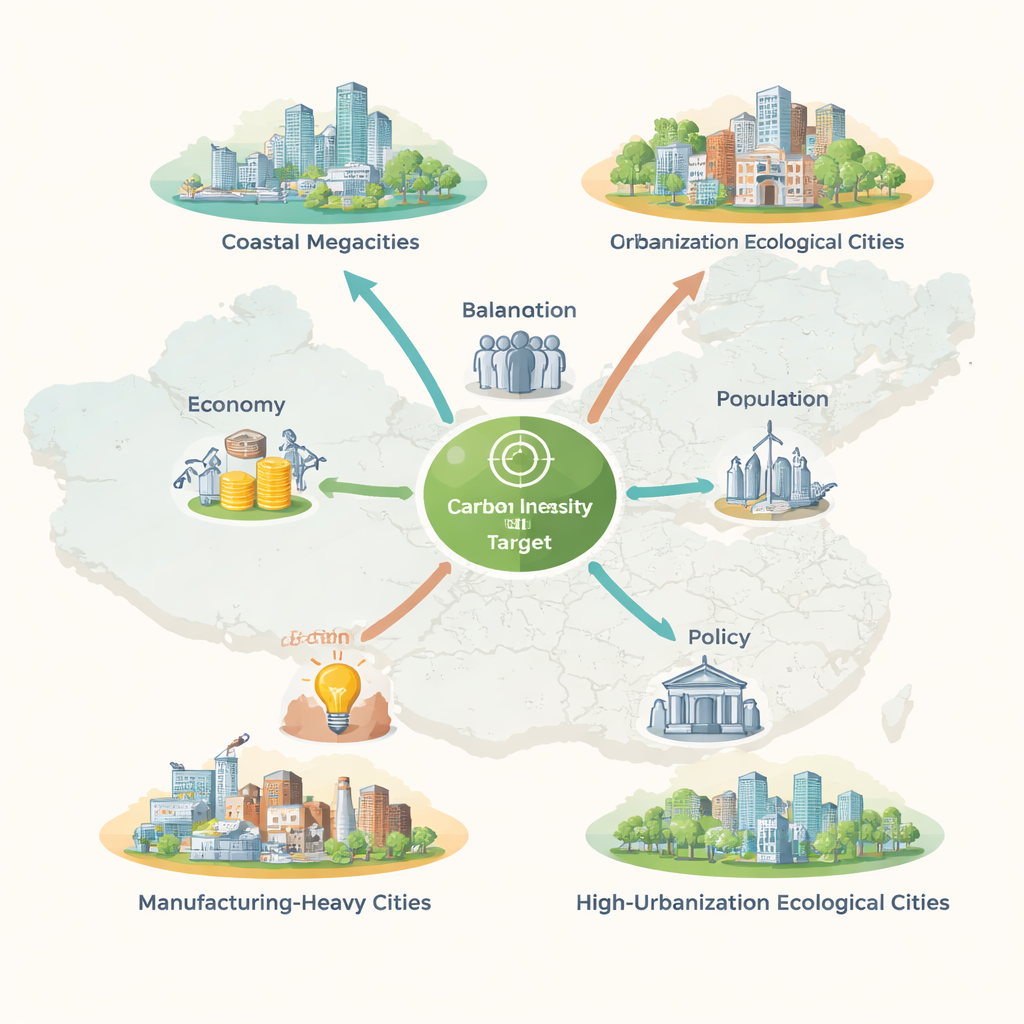
To capture how capable each city is of reducing emissions, the team built an eight-indicator scorecard grouped into five broad themes: economy, population, energy use, technological innovation and policy support. Economic strength was represented by income per person and the share of industry in the local economy. Population size and urbanization rate described how many people live in a city and how densely they are clustered. Energy use was captured through electricity consumed per unit of output, a good stand-in for how energy-hungry local industry is. Innovation and policy were reflected in patent counts, public spending on science and education and a “green finance” index that tracks how well financial systems support low‑carbon projects.
Turning data into fair targets
The researchers first used a statistical tool called the entropy method to let the data determine how important each indicator should be, rather than relying on expert guesswork. Electricity use per unit of output and the number of granted patents emerged as the most influential factors, meaning differences in these measures explain much of the variation in cities’ carbon intensity. Next, they applied an Improved Equal-Proportion Distribution method, which starts from the national 18% goal and adjusts it for each city according to its indicator scores. This generates a “Carbon Intensity Target Reduction Rate” (CITRR) for every city – essentially, how steep a cut in carbon intensity that city should aim for by 2025.
A map of uneven responsibilities
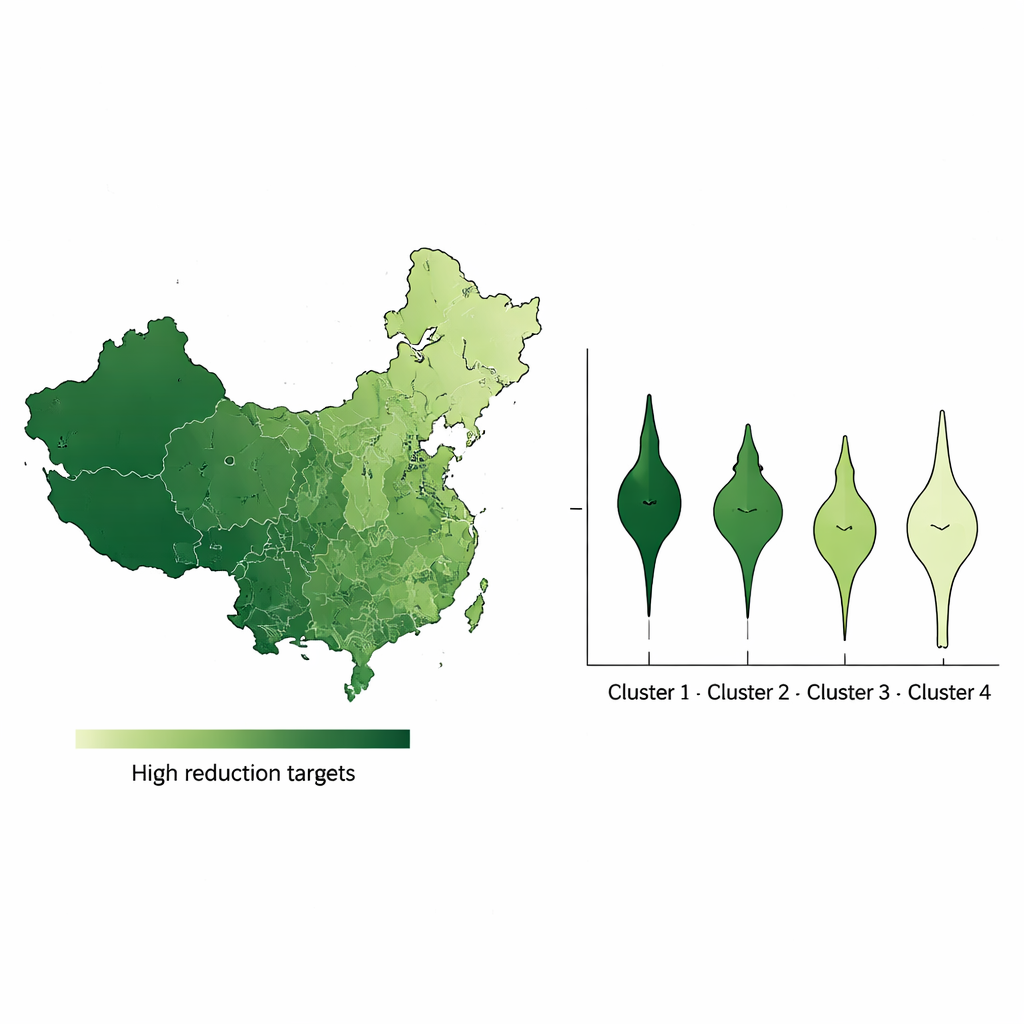
The resulting picture is starkly uneven, by design. On average, Chinese cities are assigned a 13.89% reduction in carbon intensity, but actual city-level targets range from just 4% to nearly 77%. Coastal economic powerhouses such as Shenzhen, Shanghai, Guangzhou and Beijing shoulder the heaviest responsibilities, reflecting their high incomes, dense populations and strong innovation capacity. Certain western regions with very energy‑hungry economies also receive steep targets. By contrast, ecologically important but less developed areas, especially in the northeast and far west, are assigned much more modest reductions, recognizing their limited resources and conservation roles. Statistical tests show these patterns are not random but form clear east–west and regional clusters.
Four types of cities, four policy paths
To make the results usable for policymakers, the authors grouped the 332 cities into four clusters with similar characteristics. One group consists of high-urbanization areas with relatively weak industry but strong green finance, where building low‑carbon service economies makes sense. A second group contains “average” cities that are not leading on any indicator; for them, tailored, city‑specific industrial strategies are recommended. A third group is dominated by heavy industry and faces pressure to modernize factories and strengthen urban infrastructure. The final group contains the richest, most innovative cities, which are asked to make the deepest cuts and to pioneer advanced efficiency standards, especially in energy systems, buildings and digital infrastructure.
What this means for climate action
For a lay reader, the main message is that climate policy does not have to be one‑size‑fits‑all. This study shows how a large country can translate a single national climate target into hundreds of city‑specific goals that reflect local realities. By asking more of wealthy, innovative or energy‑intensive cities and less of poorer or ecologically sensitive ones, the system aims to be both fair and effective. If implemented well, such differentiated targets could help China cut the carbon it emits per unit of economic activity without placing unreasonable strain on less developed areas, offering a template other large nations could adapt in their own push toward a low‑carbon future.
Citation: Yang, F., Ren, Y., Zuo, S. et al. Differentiated allocation of carbon intensity target reduction rates across 332 Chinese cities. Sci Rep 16, 5203 (2026). https://doi.org/10.1038/s41598-026-35781-2
Keywords: carbon intensity, China cities, emission targets, fair allocation, low-carbon development