Clear Sky Science · en
Groundwater potential zones demarcation in the hard rock province of South India: insights from remote sensing, GIS and AHP techniques
Why Finding Hidden Water Matters
In many parts of South India, people depend on wells for drinking water, farming, and daily life. Yet the water underground is invisible, unevenly distributed, and easily overused. This study focuses on Chinnalapatti firka, a small region in Tamil Nadu built on hard rock, where digging more and deeper wells is no longer a simple solution. The researchers set out to create a detailed map showing where groundwater is likely to be plentiful, where it is scarce, and how local planners can use this knowledge to secure water supplies into the future.
A Small Region with Big Water Challenges
Chinnalapatti firka is a 54-square-kilometer area near the town of Dindigul. Its economy leans on agriculture and textiles, both of which need reliable water. The climate is semi-arid: summers are hot, rainfall averages about 810 millimeters a year, and more water evaporates than falls as rain. Beneath the surface lies a tough foundation of crystalline rocks such as charnockite and migmatite gneiss. These rocks store water mainly in their cracks and weathered upper layers, so underground reserves can vary sharply from place to place. Traditional open dug wells—often 10 to 18 meters deep—may yield enough water during the monsoon but can run dry in summer, highlighting the need for smarter planning rather than simply drilling more holes.
Turning Satellite Views into Water Clues
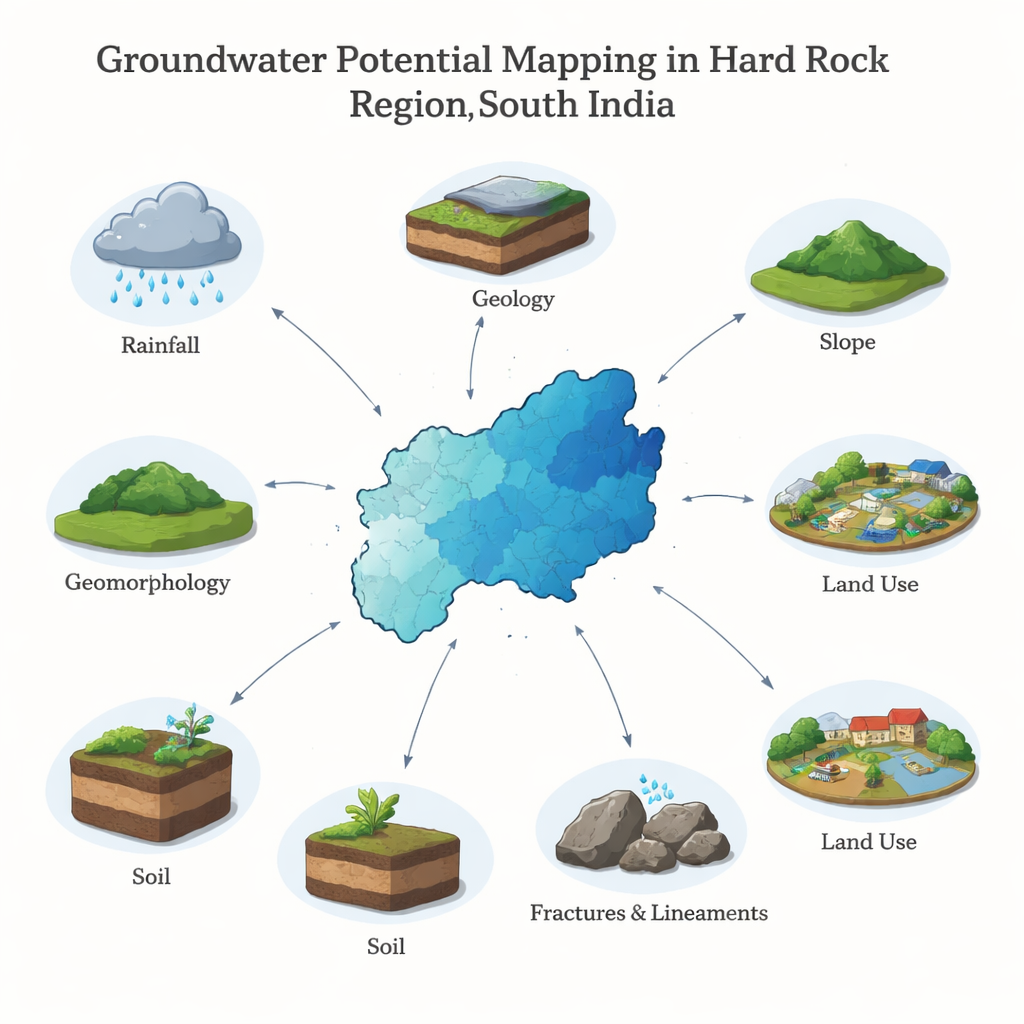
To understand where groundwater is most likely to be found, the team combined satellite images, existing government maps, and field data inside a geographic information system (GIS). They built eight separate digital layers that each describe a factor affecting underground water: rainfall, rock type, landforms, soil, land use, surface slope, stream network, and zones of rock fractures known as lineaments. For instance, gentle slopes and low stream density usually allow more rainwater to seep into the ground, while dense stream networks tend to carry water away quickly. Forests and croplands can encourage infiltration compared with paved or bare surfaces, and certain fractured rock types can act as better natural reservoirs than solid, unbroken rock.
Letting a Decision Tool Weigh the Evidence
Not all factors matter equally, so the researchers used a method called the Analytic Hierarchy Process, a structured decision tool that turns expert judgments into numerical weights. Through systematic pairwise comparisons—asking, in effect, whether rainfall is more important than slope, slope more important than soil, and so on—they ranked rainfall as the single most influential factor, while still accounting for geology, slope, drainage, fractures, land use, soil, and geomorphology. Each map layer and its subcategories (for example, different slope ranges or soil types) were converted into scores and combined with these weights to calculate a Groundwater Potential Index for every 30-by-30-meter cell across the region.
Where the Ground Is Most Generous
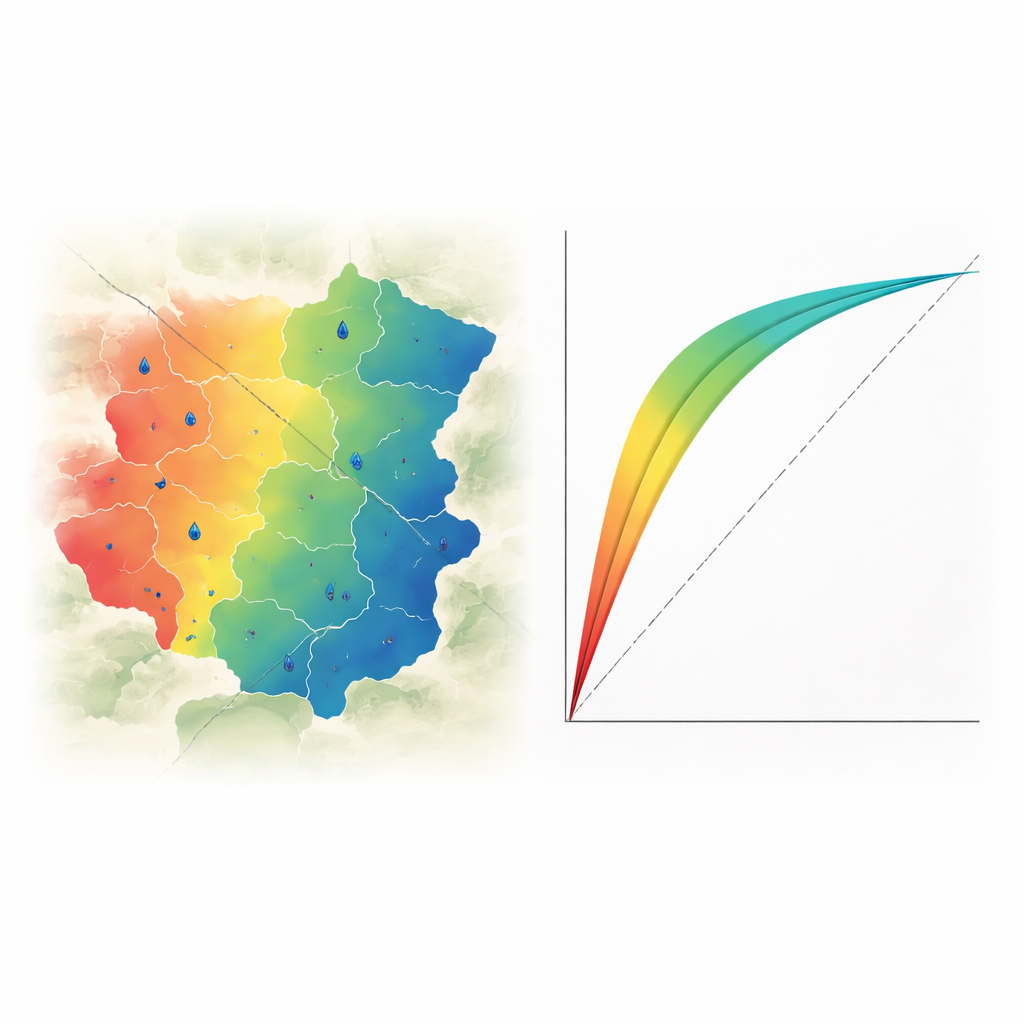
The final map divides Chinnalapatti firka into five classes: very poor, poor, moderate, good, and very good groundwater potential. Roughly one fifth of the area falls into the very good category, about one third is good, another third is moderate, and the remaining portion is poor or very poor. The most promising zones tend to occur where rainfall is relatively higher, slopes are gentle, drainage is sparse, and fractured, favorable rock units coincide with suitable soils and landforms such as pediplains. To check that the map reflects reality, the team compared it with well-yield records and applied a standard diagnostic test known as a ROC curve. The resulting score—an area under the curve of about 0.80—indicates that the model distinguishes high- and low-yield locations with good reliability.
Guiding Better Wells and Smarter Recharge
For non-specialists, the main message is straightforward: even in a hard, dry landscape, underground water is not random. By carefully layering satellite observations, local maps, and a transparent weighting method, this study pinpoints where wells are most likely to succeed and where they risk failure. The resulting groundwater potential map can guide farmers, engineers, and local authorities to place new wells and artificial recharge structures—such as check dams and percolation ponds—in the most favorable spots, reducing wasted investment and over-pumping in fragile zones. In doing so, it provides a practical blueprint for more sustainable groundwater use in Chinnalapatti and offers a transferable approach for other water-stressed regions built on hard rock.
Citation: Pragadeeshwaran, K., Gurugnanam, B., Bagyaraj, M. et al. Groundwater potential zones demarcation in the hard rock province of South India: insights from remote sensing, GIS and AHP techniques. Sci Rep 16, 6186 (2026). https://doi.org/10.1038/s41598-026-35734-9
Keywords: groundwater mapping, remote sensing, GIS, water resources, South India