Clear Sky Science · en
A satellite based machine learning approach for estimating high resolution daily average air temperature in a megacity in Brazil
Why city heat is not the same everywhere
On a hot day in a big city, the temperature you feel on a tree-lined street can be very different from what someone experiences on a concrete plaza a few blocks away. Yet most health and climate studies still treat an entire city as if it had a single temperature. This paper shows how scientists used satellites, weather models and machine learning to map daily temperatures across São Paulo, Brazil, in fine detail—helping reveal who is really exposed to dangerous heat and where cooling efforts are most needed.
Taking the city’s temperature in high definition
Traditional temperature records rely on a limited number of weather stations, often clustered near airports or wealthier districts. That makes it hard to see how heat is distributed across real neighborhoods, especially in large cities and in low- and middle-income countries, where monitoring networks are sparse. The researchers focused on São Paulo, a vast and highly varied megacity of more than 22 million people. They aimed to estimate the daily average air temperature for every 500-by-500 meter square across the metropolitan area over five years, from 2015 to 2019, creating one of the most detailed citywide temperature datasets yet available in South America.
Blending satellites, weather models and ground sensors
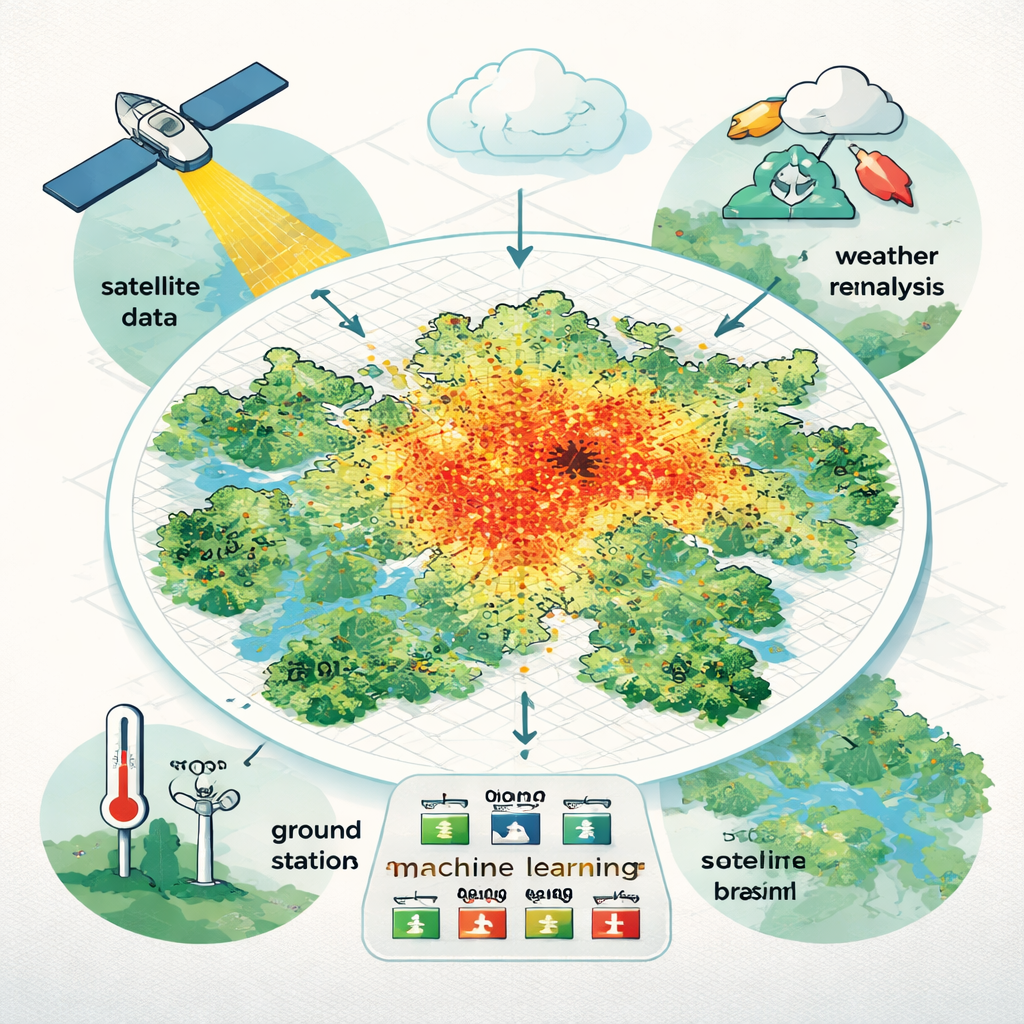
To build this high‑resolution picture, the team combined several types of freely available data. They gathered measurements from 48 ground stations, which provide the most direct readings of air temperature but only at specific points. They then pulled in satellite observations of land surface temperature, the angle of the sun, and how reflective the ground is, along with information about humidity, wind, and pressure from a global weather “reanalysis” product that reconstructs hourly weather on a coarse grid. These ingredients were resampled to match the 500‑meter grid and cleaned to fill gaps due to clouds or missing satellite passes. In total, they tested 23 possible predictor variables that might help explain how heat varies across space and time.
Training a learning machine to read the heat
Rather than using a simple straight‑line (linear) equation, the scientists turned to a Random Forest, a popular machine learning method that builds many decision trees and averages their results. This approach is well suited to uncovering complex, non‑linear relationships, such as how temperature responds differently to surface heat, humidity and wind in different parts of the city or at different times of year. To avoid overfitting to the quirks of a few stations, they used a step‑by‑step feature selection process that keeps only variables that genuinely improve predictions, and they validated the model in two ways: by repeatedly leaving out groups of stations during training, and by holding back five entire stations as a strict external test of how well the model performs in new locations.
What the detailed maps reveal
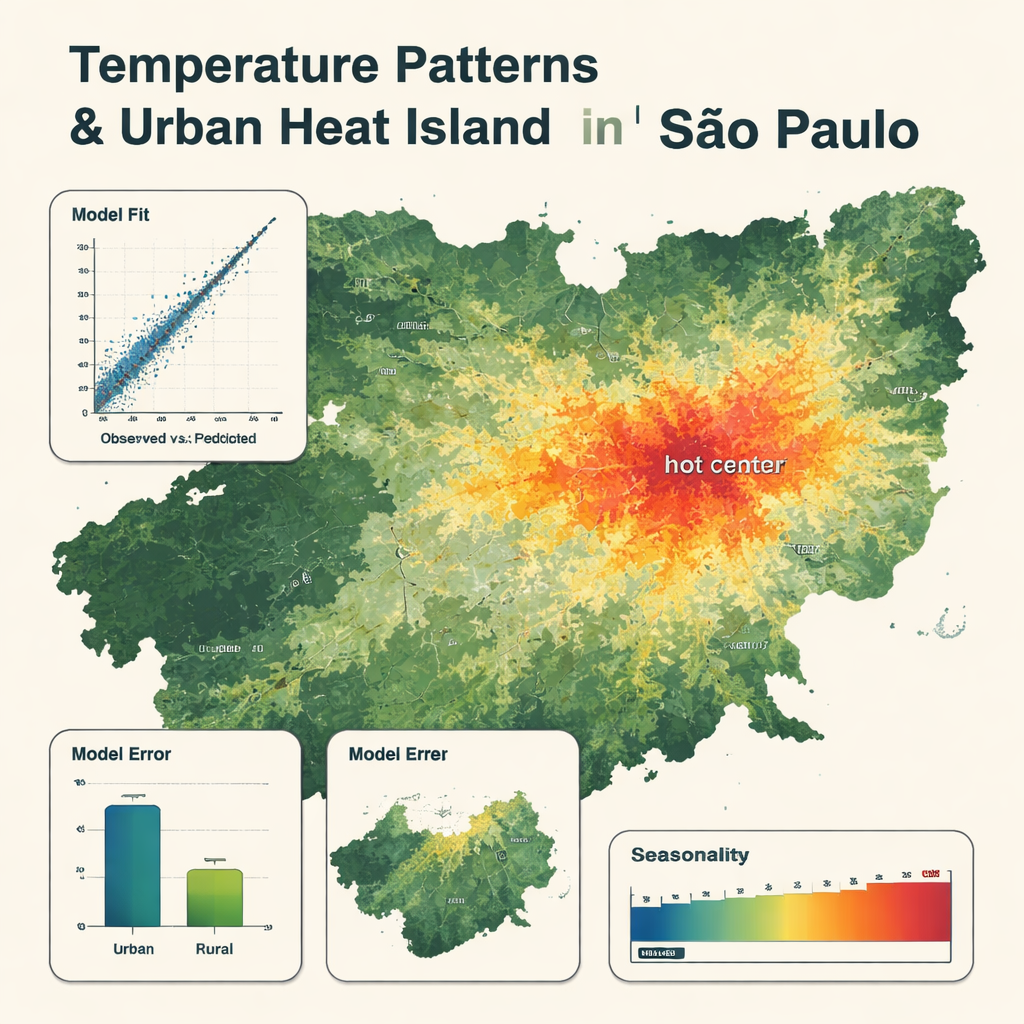
The final model used just eight key variables, led by air temperature from the global weather product, with satellite surface temperature and humidity also playing important roles. It reproduced station readings very closely, with an average error of about 0.8 °C and a very high match between observed and predicted temperatures. The maps show clear patterns: cooler zones over forests, mountains and large reservoirs, and hotter zones in the dense, built‑up city center, where temperatures can be up to 5 °C higher than nearby rural areas. The model captured seasonal swings, with hottest conditions from December to March and coolest from May to August. It was somewhat less accurate in rural areas and tended to smooth out the most extreme hot and cold days, but it still outperformed a more traditional multi‑linear regression model using the same inputs.
Why these maps matter for people’s health
By turning scattered measurements and satellite snapshots into daily, street‑scale temperature estimates, this work offers a powerful new tool for public health and urban planning in São Paulo and beyond. Researchers can now study how heat affects different neighborhoods, including informal settlements that are often missing from official records, and identify where residents are most at risk during heat waves. Because the method relies entirely on open data and standard software, it can be adapted to other cities that have some ground stations and similar satellite coverage. In plain terms, the study shows that we can now “see” urban heat with much finer detail, providing an essential foundation for fairer, more targeted climate adaptation and protection of vulnerable communities.
Citation: Roca-Barceló, A., Schneider, R., Pirani, M. et al. A satellite based machine learning approach for estimating high resolution daily average air temperature in a megacity in Brazil. Sci Rep 16, 7459 (2026). https://doi.org/10.1038/s41598-026-35689-x
Keywords: urban heat, machine learning, satellite data, São Paulo, air temperature