Clear Sky Science · en
Optimizing unsupervised clustering of electrochemical impedance spectra via normalization and dimensionality reduction
Why this matters for real-world metals
Modern infrastructure, medical implants and batteries all rely on metals that must resist corrosion for years. Engineers use a technique called electrochemical impedance spectroscopy (EIS) to probe how protected or vulnerable a metal surface is, but the resulting spectra are complex squiggly lines that are slow and subjective to interpret. This study shows how simple, unsupervised machine-learning tools can automatically sort those spectra into meaningful groups, helping non-experts judge metal “health” quickly and consistently.
From messy signals to readable patterns
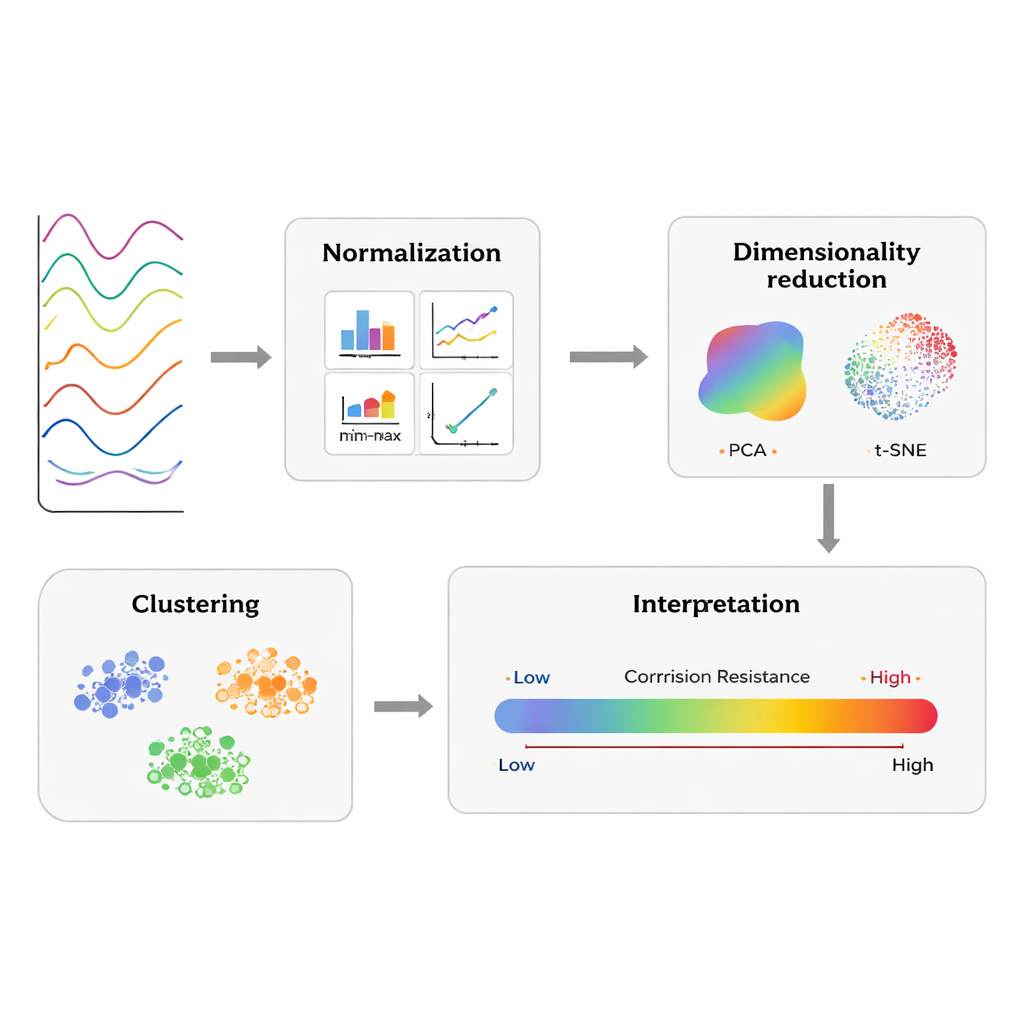
EIS records how an electrical signal passes through a metal–electrolyte interface over a wide range of frequencies. Traditionally, experts fit these measurements with circuit models to infer what is happening on the surface. The authors explore a more direct path: let algorithms look only at the shapes of the spectra and discover patterns on their own, without any prior labels or models. They focus on two key design choices that are often treated as afterthoughts—how the raw data are scaled (normalization) and how their many dimensions are compressed into a few that humans and clustering algorithms can handle (dimensionality reduction). Their message is that these “front-end” decisions can make or break unsupervised analysis.
Testing ways to clean and compress the data
The team used a carefully characterized set of EIS spectra from welded 316L stainless steel. Each spectrum came from either the base metal or the heat-affected zone, and from surfaces that were left as-welded, mechanically cleaned, or chemically passivated with different acids. Visually, the Bode plots of these spectra strongly overlap, making it hard to tell states apart by eye. The authors tried four ways of preparing the data: leaving them raw, scaling entire datasets together (per-block normalization), scaling each spectrum individually (per-sample normalization), and standardizing each frequency point across samples (per-column autoscaling). They then applied three popular dimensionality-reduction methods: principal component analysis (PCA), the non-linear t-SNE method, and a sequential combination where PCA first reduces noise before t-SNE refines the layout.
Letting clusters speak for surface condition
Once the spectra were embedded in a low-dimensional space, the authors used hierarchical clustering to group them and evaluated every combination of normalization, embedding method and number of clusters. They relied on internal quality scores that reward groups that are compact and well separated, and combined these scores using a voting-style scheme called Borda ranking. The best-performing recipe turned out to be per-block normalization followed by the PCA+t-SNE pipeline, with the data divided into six clusters. Although the original experiment defined eight surface subgroups, the six-cluster solution merged a couple of nearly indistinguishable pairs, yielding a map that matched realistic expectations about how different weld regions and treatments should behave.
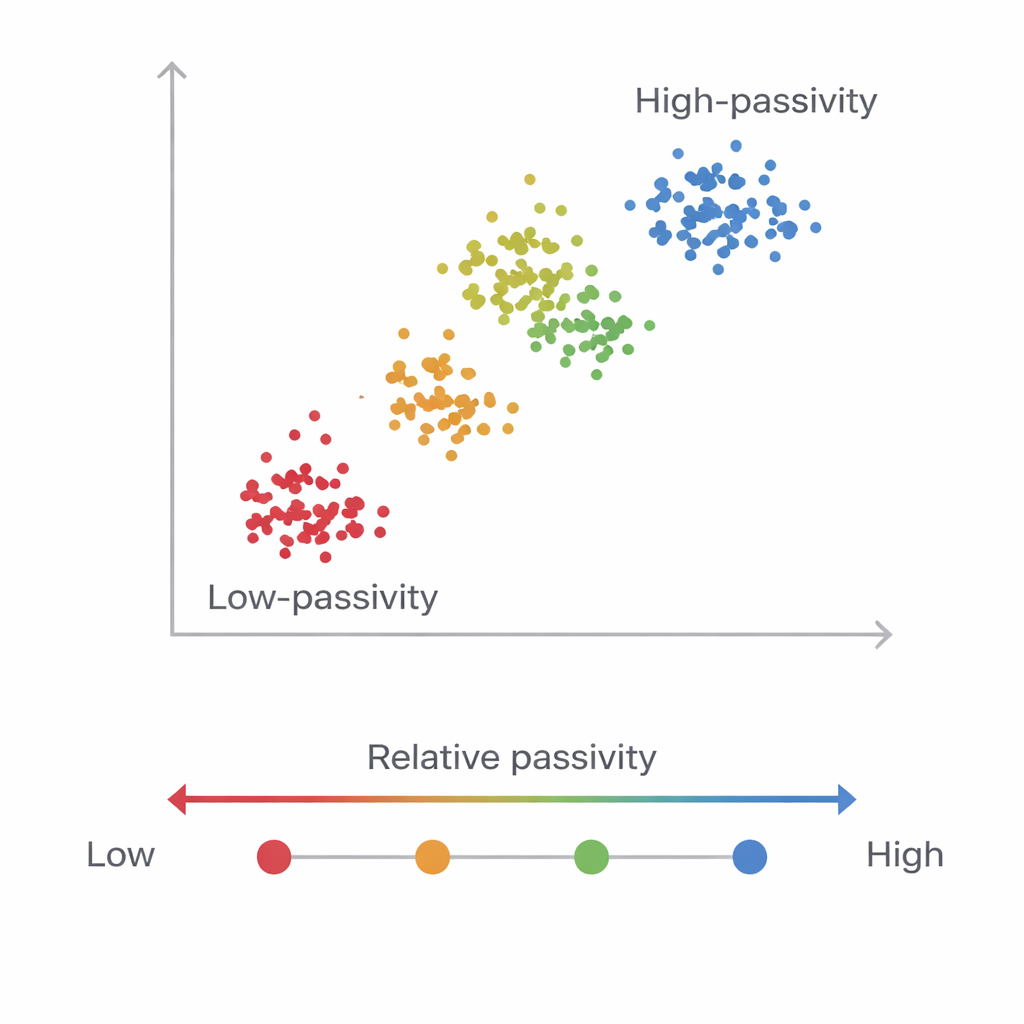
Ranking corrosion resistance along a spectrum
To turn clusters into a more intuitive story for corrosion engineers, the authors anchored their reduced map between two reference states: a freshly abraded surface representing very low passivity, and a nitric-acid-passivated surface representing very high passivity. By progressively increasing the number of clusters, they showed how all other samples fall in between these extremes in a graded sequence of “relative passivity.” Mechanically cleaned heat-affected zones consistently appeared at the low-resistance end, while passivated, as-welded surfaces approached the high-resistance reference. Importantly, these patterns remained stable under rigorous bootstrap resampling tests, meaning that small changes in the dataset did not scramble the cluster structure.
What the findings mean in plain terms
In essence, the study demonstrates that with thoughtful scaling and dimensionality reduction, a computer can reliably sort complex EIS spectra into a handful of clusters that line up with how corrosion specialists already think about surface quality and protection level. The approach does not replace detailed physical modelling, but it offers a fast, transparent and model-free way to classify new measurements and assign them a position on a practical “passivity scale.” That makes it a promising tool for automated monitoring of welded components, implants and other critical metal parts, especially in settings where rapid, robust decisions matter more than a full microscopic explanation.
Citation: Martinez, S., Bera, I., Martinez, I. et al. Optimizing unsupervised clustering of electrochemical impedance spectra via normalization and dimensionality reduction. Sci Rep 16, 5833 (2026). https://doi.org/10.1038/s41598-026-35621-3
Keywords: electrochemical impedance spectroscopy, unsupervised clustering, dimensionality reduction, stainless steel corrosion, machine learning for materials