Whenever governments, scientists or pollsters try to learn something about a whole population—such as average income, crop yield or pollution levels—they can rarely measure everyone. Instead, they draw a sample and scale up. This works well only if the data behave nicely. In real life, however, surveys and measurements are riddled with errors and extreme values that can badly distort results. This article introduces a new way to calculate population averages that stays reliable even when the data are messy, making survey-based decisions more trustworthy.
When simple averages go wrong
Standard tools for estimating a population mean, like the plain sample average or ordinary regression, assume that most data points follow smooth patterns, without extreme outliers or unusual cases. In social and economic surveys, environmental monitoring and agricultural statistics, that hope is often unmet. A few faulty readings, rare but extreme events, or misreported answers can pull estimates away from the truth, increasing both bias and uncertainty. Earlier work tried to blunt the impact of such outliers using so-called robust methods, including a popular approach known as Huber M-estimation. While helpful, these methods mainly protect against extreme values in the outcome being measured and remain vulnerable to unusual patterns in the accompanying explanatory information.
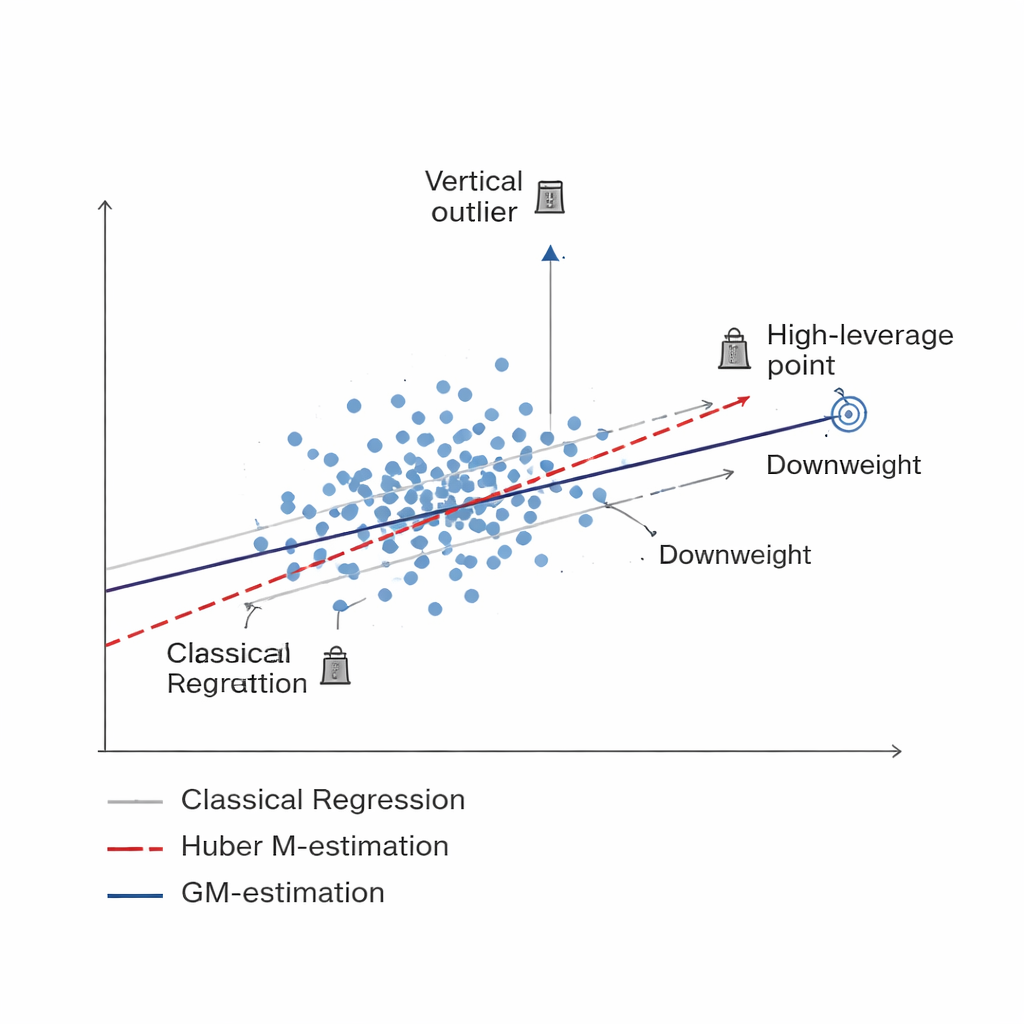
A smarter way to downweight bad data Figure 1.
The study develops a new family of estimators built on Generalized M-estimation, or GM-estimation. Instead of treating every sampled unit equally, GM methods assign adaptive weights that depend on two things at once: how extreme a unit’s response is (a vertical outlier) and how unusual its associated information is (a high-leverage point). Three specific versions—called Mallows-GM, Schweppes-GM and SIS-GM—are designed for common survey setups, including simple random sampling without replacement and more complex stratified designs where the population is split into relatively uniform groups. By jointly controlling both types of problematic observations, these estimators aim to keep the final estimate of the population mean stable even when the data contain serious contamination.
Putting the new estimators to the test
To see how well the GM-based estimators work, the author performs extensive numerical experiments. First, real tobacco agriculture data are analyzed in two forms: a clean version and a deliberately contaminated version where one unit is replaced by extreme values. The new estimators are compared with traditional regression and Huber-based robust methods using a measure called percent relative efficiency, which reflects how much smaller the estimation error is. Across a wide range of sample sizes, the GM estimators consistently outperform the older methods, particularly when the data include extreme values. In some scenarios, the best-performing GM estimator reduces error by more than 50 percent compared with the Huber approach.
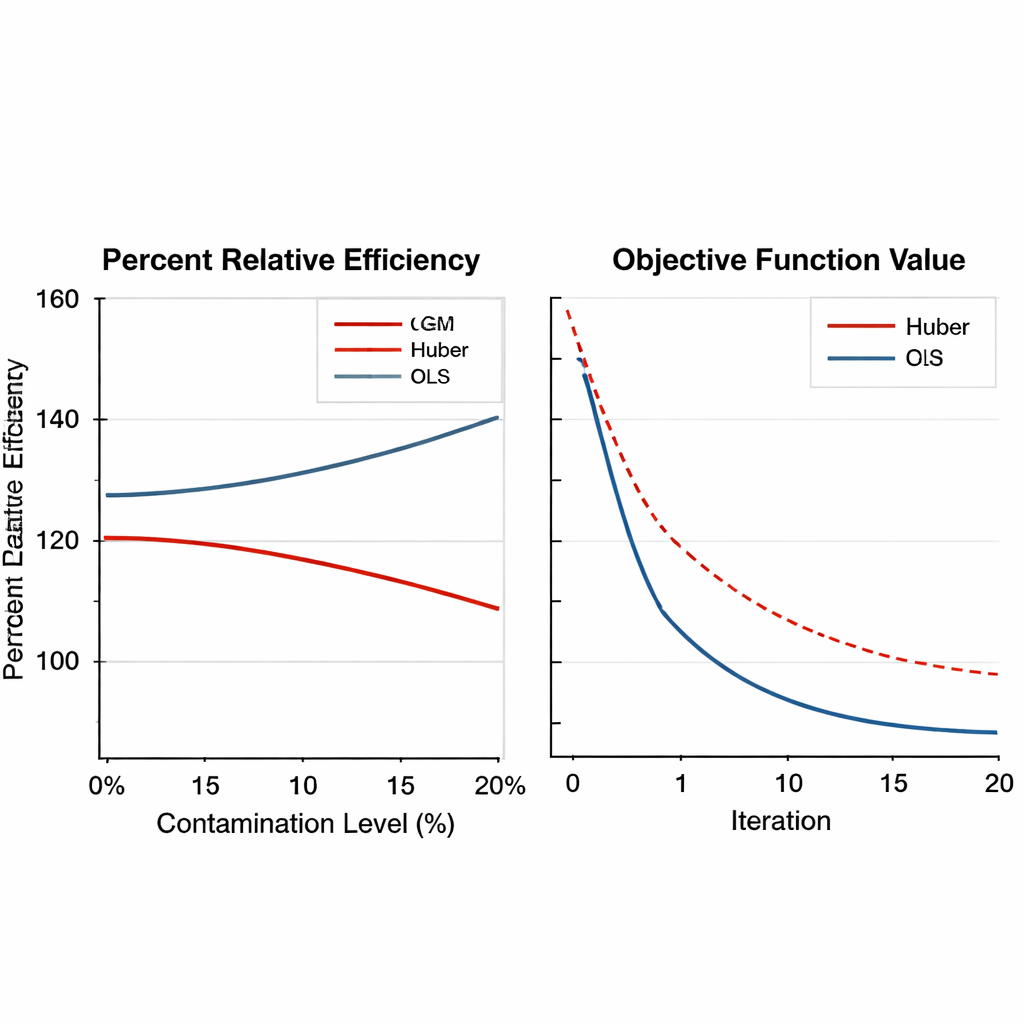
Robustness across designs, settings and tuning choices Figure 2.
The paper then broadens the tests using large-scale computer simulations. Artificial populations are generated under several shapes—normal, skewed and heavy-tailed distributions—and contaminated with varying fractions of outliers, from none up to 20 percent. Both simple and stratified sampling plans are considered, and the strength of the relationship between the main variable and its helpers is varied from weak to strong. The GM estimators not only maintain their edge under heavy contamination, often reaching efficiency gains above 150 percent, but also show smooth and reliable numerical convergence. Importantly, their performance changes little when the internal tuning settings are adjusted within reasonable ranges, which means that practitioners do not need to fine-tune them delicately for each new survey.
What this means for real-world surveys
In plain terms, the article shows that the proposed GM-based estimators provide a safer way to turn imperfect samples into estimates of population-wide averages. Under ideal, clean data conditions they are about as accurate as classical methods. But when the data include measurement errors, misreported values or rare extreme events—as is common in national surveys, environmental monitoring and financial statistics—they deliver substantially more reliable answers. Because they are computationally feasible and work well across different designs and settings, these estimators offer survey practitioners a practical upgrade that can make evidence-based decisions more resilient to the inevitable messiness of real-world data.
Citation: Abuhasel, K.A. A robust methodology for finite population mean estimation based on Generalized M estimation.
Sci Rep16, 5182 (2026). https://doi.org/10.1038/s41598-026-35592-5
Keywords: survey sampling, robust estimation, outliers, generalized M-estimation, finite population mean