Clear Sky Science · en
Current transformer (CT) saturation classification using empirical mode decomposition (EMD) and relevance vector machine (RVM)
Why this matters for keeping the lights on
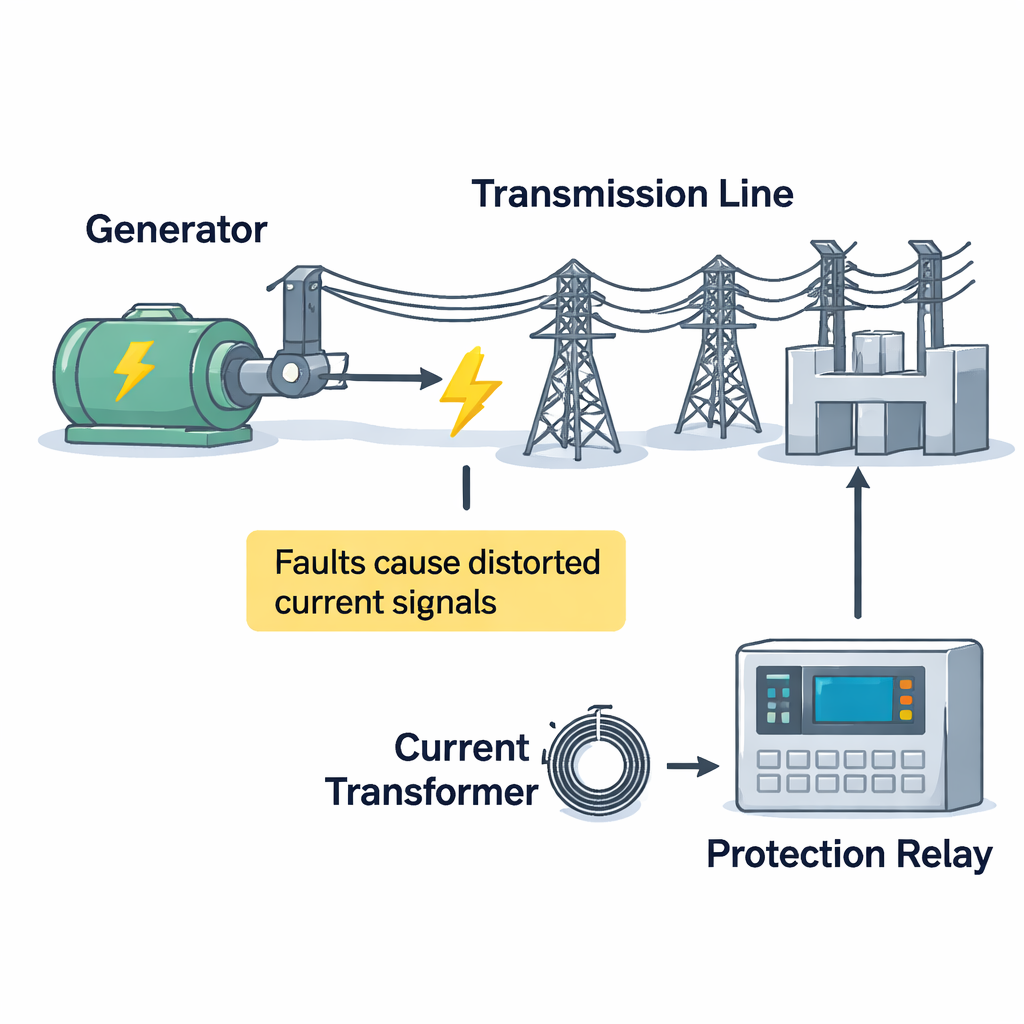
Modern power grids rely on protective devices that must decide, in a few thousandths of a second, whether to disconnect equipment when a fault occurs. Those decisions depend on sensors called current transformers (CTs), which scale down large currents so electronics can measure them safely. When CTs become “saturated,” they stop reporting the true current, and protection systems can hesitate or trip unnecessarily—risking blackouts or damaged hardware. This study presents a new data-driven method to spot CT saturation quickly and reliably, even under noisy, rapidly changing grid conditions.
The hidden weakness in a critical sensor
Current transformers act like precise measuring funnels, turning thousands of amperes in a power line into a small, manageable signal for relays and meters. But during faults—such as short circuits on long transmission lines—the CT’s magnetic core can be pushed beyond its comfort zone. Once saturated, the output waveform becomes distorted and “flat-topped,” no longer faithfully mirroring the real current. Protection relays that depend on this distorted signal can misjudge whether a fault is inside or outside a protected zone. Earlier approaches to detect saturation typically used fixed thresholds, simple waveform slopes, or specific CT models, and they often struggled with noise, changing loads, and subtle, early-stage saturation.
Simulating many ways a grid can go wrong
To rigorously test new ideas, the authors built a detailed computer model of a power system in PSCAD, linking a generator, transmission line, and protective equipment. They injected faults at many different points on the line, varied fault types (such as line-to-ground and three-phase faults), adjusted fault resistance, and altered the angle at which a fault began on the voltage wave. They also changed CT-specific factors like the burden on the secondary side, the amount of leftover magnetism in the CT core, and the noise level in measurements. Using a realistic hysteresis model for the CT, they generated more than 200,000 examples of current waveforms spanning three categories: no saturation, mild saturation, and severe saturation. This large, carefully structured dataset ensured that the method would be tested across conditions that protection engineers encounter in practice.
Breaking complex waves into simpler pieces
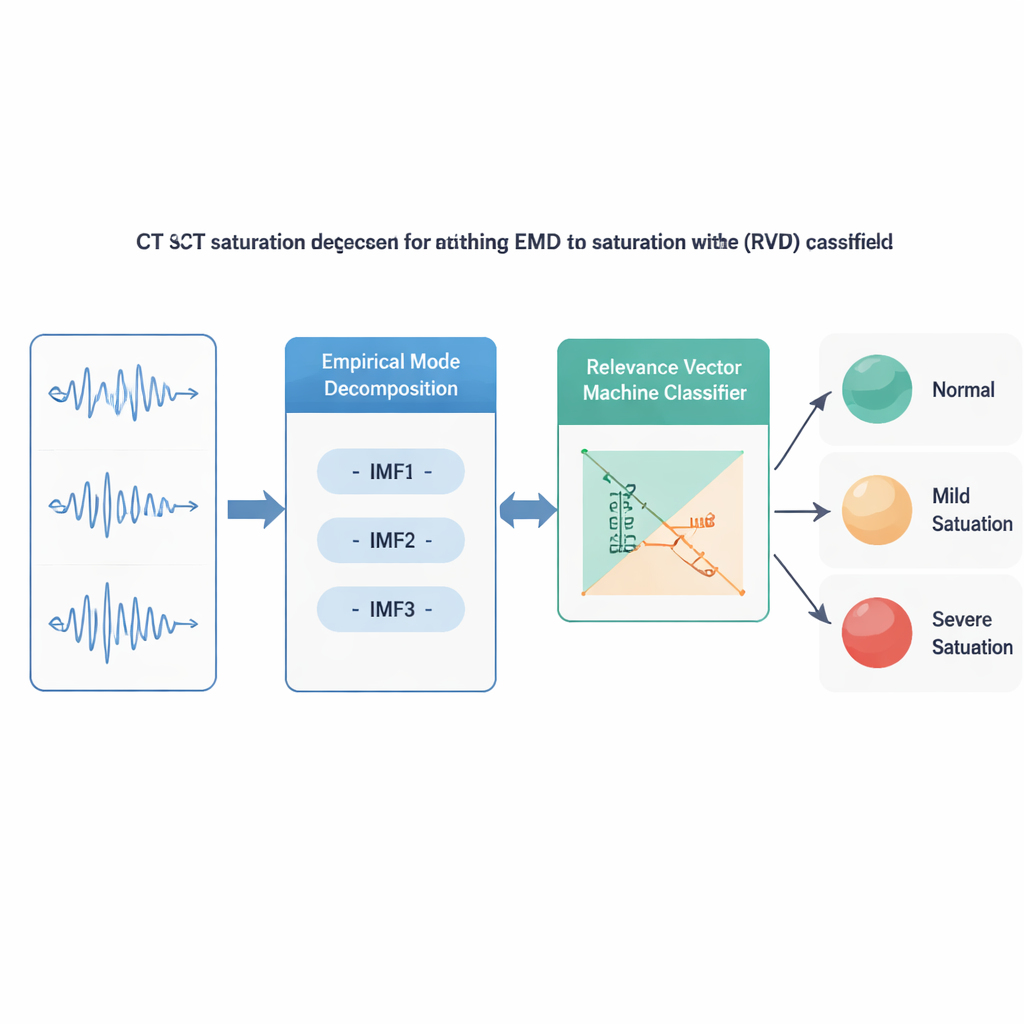
The core of the proposed scheme is a signal-processing method called Empirical Mode Decomposition (EMD). Instead of assuming that all signals can be described with fixed sine waves, EMD adaptively breaks each CT current waveform into simpler building blocks called Intrinsic Mode Functions. These components naturally isolate high-frequency bursts and subtle shape changes that appear when a CT first begins to saturate. From these components, the authors compute a compact set of descriptive features: how the energy is distributed across frequencies, how “peaked” or skewed the wave becomes, how its instantaneous frequency jumps, and how spread-out or ordered the energy is over time. Together, these features capture both obvious and hidden signs of saturation that would be easy for a human eye to miss.
Letting a smart classifier make the call
Once the features are extracted, they are fed into a machine-learning model called a Relevance Vector Machine (RVM), and, for comparison, a standard Support Vector Machine (SVM). Both classifiers learn from 80% of the simulated cases and are then tested on the remaining 20%. The RVM takes a Bayesian approach: it automatically discards unhelpful features, keeping only a small set of “relevance vectors” that matter most for the decision. This results in a compact model that still provides probabilities for whether a given signal is normal, mildly saturated, or severely saturated. The authors show that the EMD features separate these three classes cleanly when visualized, and that the RVM can reach a decision in about 23.5 milliseconds—fast enough to stay well ahead of typical relay decision times of 50–60 milliseconds.
How well it works and what comes next
On thousands of test cases, both classifiers detect CT saturation with very high accuracy, but the RVM consistently performs best. Overall, the RVM correctly classifies about 99.7% of cases, with especially strong performance in normal and mildly saturated conditions, where subtle distortions matter most. It needs far fewer support points than the SVM, making it computationally efficient and attractive for real-time use in digital relays. The team has also built a laboratory hardware-in-the-loop setup to generate real CT waveforms under controlled fault conditions, laying the groundwork to validate the method beyond simulations. In plain terms, the study shows that by combining adaptive signal decomposition with a lean, probabilistic learning model, utilities can spot CT saturation early and reliably—helping protective relays make better, faster decisions and improving the overall resilience of the power grid.
Citation: Chothani, N., Vyas, P., Sonawane, C. et al. Current transformer (CT) saturation classification using empirical mode decomposition (EMD) and relevance vector machine (RVM). Sci Rep 16, 5754 (2026). https://doi.org/10.1038/s41598-026-35444-2
Keywords: current transformer saturation, power system protection, fault detection, empirical mode decomposition, machine learning in grids