Clear Sky Science · en
A hybrid prediction model for PM2.5 concentration based on high-frequency and low-frequency IMFs with EMD decomposition
Why cleaner air forecasts matter to everyday life
Fine particles in the air, known as PM2.5, are tiny enough to slip deep into our lungs and even enter the bloodstream. In North China, where heavy industry and winter heating are concentrated, these particles often reach levels that can trigger health warnings, disrupt travel, and even shut down factories and schools. This study asks a very practical question: can we predict hour‑by‑hour PM2.5 levels more accurately, so that cities and residents get earlier and more reliable warnings before the air turns hazardous?
A closer look at North China’s dirty air
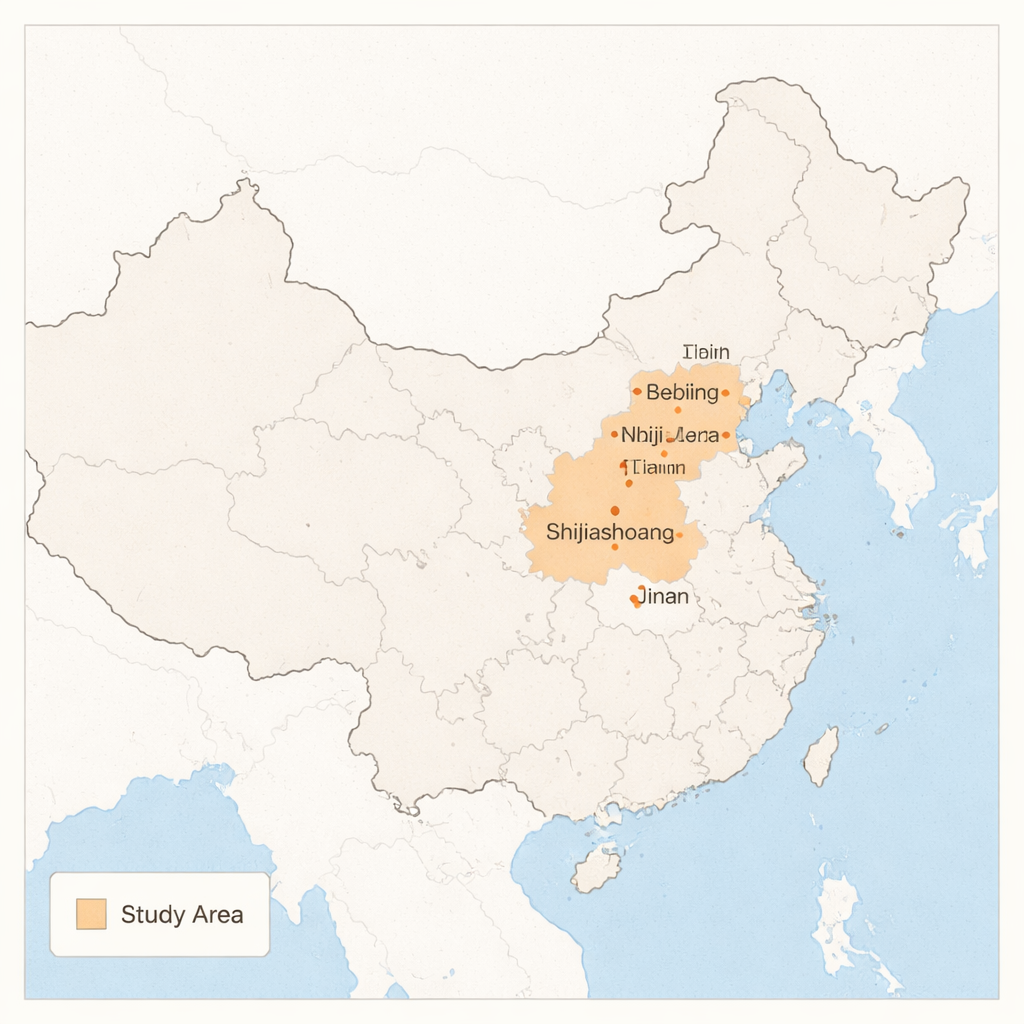
The researchers focused on six major cities in North China: Beijing, Tianjin, Shijiazhuang, Taiyuan, Jinan, and Zhengzhou. These cities represent densely populated, industrialized areas where pollution episodes are frequent, especially in winter. Using official monitoring data, the team collected hourly PM2.5 readings for the entire year of 2021, yielding 8,760 data points for each city. They found that pollution levels varied widely between cities; for instance, Taiyuan had the highest average PM2.5, while Beijing had the lowest. Extreme events were striking: in Taiyuan, concentrations spiked to 652 micrograms per cubic meter during a March dust and pollution episode, pushing the air quality index to its maximum level, a clear sign of seriously polluted air.
Why predicting PM2.5 is so hard
PM2.5 levels are pushed and pulled by many forces at once—local emissions from traffic and factories, regional transport of dust and smoke, wind speed, humidity, and more. As a result, the pollution record behaves less like a smooth curve and more like a jagged, restless heartbeat. Traditional statistical tools or even modern neural networks can struggle with this kind of data: they may capture the general trend but miss sudden surges, or they may work in one city but fail in another. Earlier studies tried to improve forecasts either by adding more physical detail (such as chemical transport models) or by relying solely on sophisticated machine‑learning methods. This paper instead combines several methods, each chosen to handle a different “rhythm” in the data.
Splitting the signal into fast and slow rhythms
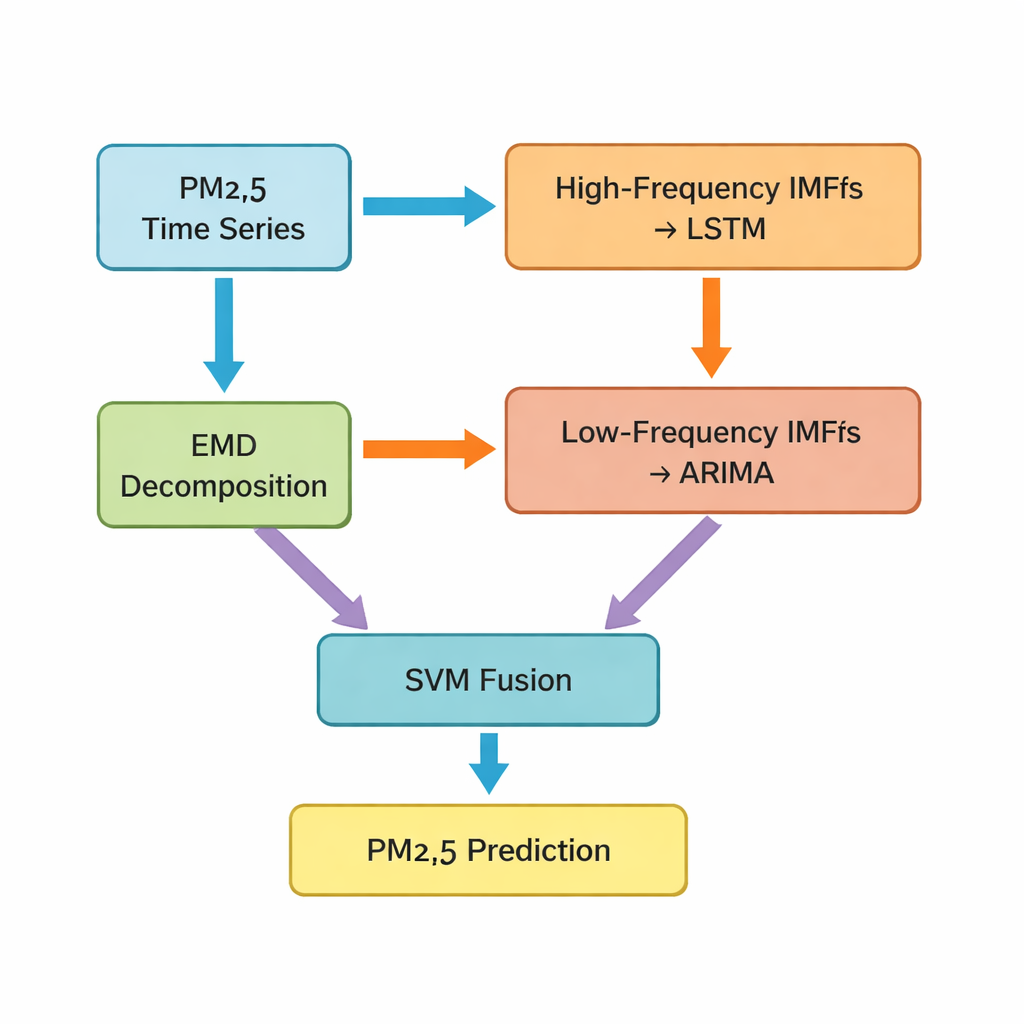
The key step is a technique called empirical mode decomposition, which breaks the original PM2.5 time series into several simpler components. Some of these components wiggle rapidly and capture short‑term spikes and noise; others change slowly and reflect the underlying trend. The authors group the first five components as “high‑frequency” parts and the remaining ones, plus a residual trend, as “low‑frequency” parts. High‑frequency pieces, which are more irregular and strongly nonlinear, are fed into a long short‑term memory (LSTM) network, a type of deep learning model well suited to learning patterns over time. The smoother, low‑frequency components are passed to a classic time‑series method known as ARIMA, which is effective when the data behave in a more regular, near‑linear fashion.
Blending different models into one smarter forecast
After the LSTM and ARIMA models each produce their own partial forecasts, the study still faces a challenge: how to merge these separate predictions into one final, best‑guess PM2.5 value for the next hour. For this, the authors use a support vector machine (SVM), another machine‑learning method that learns how to weight and combine the two inputs. In essence, the SVM acts like a referee, deciding when the “fast” view of the world (high‑frequency patterns) matters more, and when the “slow” view (long‑term trends) should dominate. The combined system, which the authors call Hybrid‑EMDHL, is then evaluated using several performance indicators, including average error, how closely predictions match observed values, and how well the model gets the direction of change—whether levels are going up or down.
Clearer warnings and better planning
The hybrid model outperforms either of its main components used alone across all six cities. It not only reduces average and squared errors but also greatly improves the ability to correctly anticipate whether PM2.5 will rise or fall in the next hour—a critical feature for issuing timely health advisories. In many cases, the hybrid approach cuts error measures by more than half compared with a single neural‑network model, and its “direction accuracy” exceeds 0.69, meaning that in well over two‑thirds of the test cases it correctly predicts the trend. For a layperson, this means weather‑style air quality forecasts that are both sharper and more reliable. For city planners and health authorities, it offers a practical tool to support targeted, early actions—such as adjusting industrial operations or traffic controls—before a pollution episode peaks, helping to reduce exposure and protect daily life in some of China’s most polluted urban regions.
Citation: Wang, P., Wu, Q. & Zhang, G. A hybrid prediction model for PM2.5 concentration based on high-frequency and low-frequency IMFs with EMD decomposition. Sci Rep 16, 4969 (2026). https://doi.org/10.1038/s41598-026-35386-9
Keywords: PM2.5 forecasting, air pollution, North China, machine learning, time series decomposition