Clear Sky Science · en
Informed spatially aware patterns for multiplexed immunofluorescence data
Why the Neighborhood of Tumor Cells Matters
Pancreatic cancer is one of the deadliest cancers, in part because its tumors live inside a complex “neighborhood” of immune and support cells that can either fight the cancer or help it hide. This study introduces a new way to read the spatial layout of those cells in microscope images, revealing how the immune system behaves differently in aggressive pancreatic ductal adenocarcinoma (PDAC) versus its precancerous cousin, intraductal papillary mucinous neoplasm (IPMN). Understanding these hidden patterns could point to better diagnostics and smarter, more targeted treatments.
Seeing Tissues as Maps, Not Just Pictures
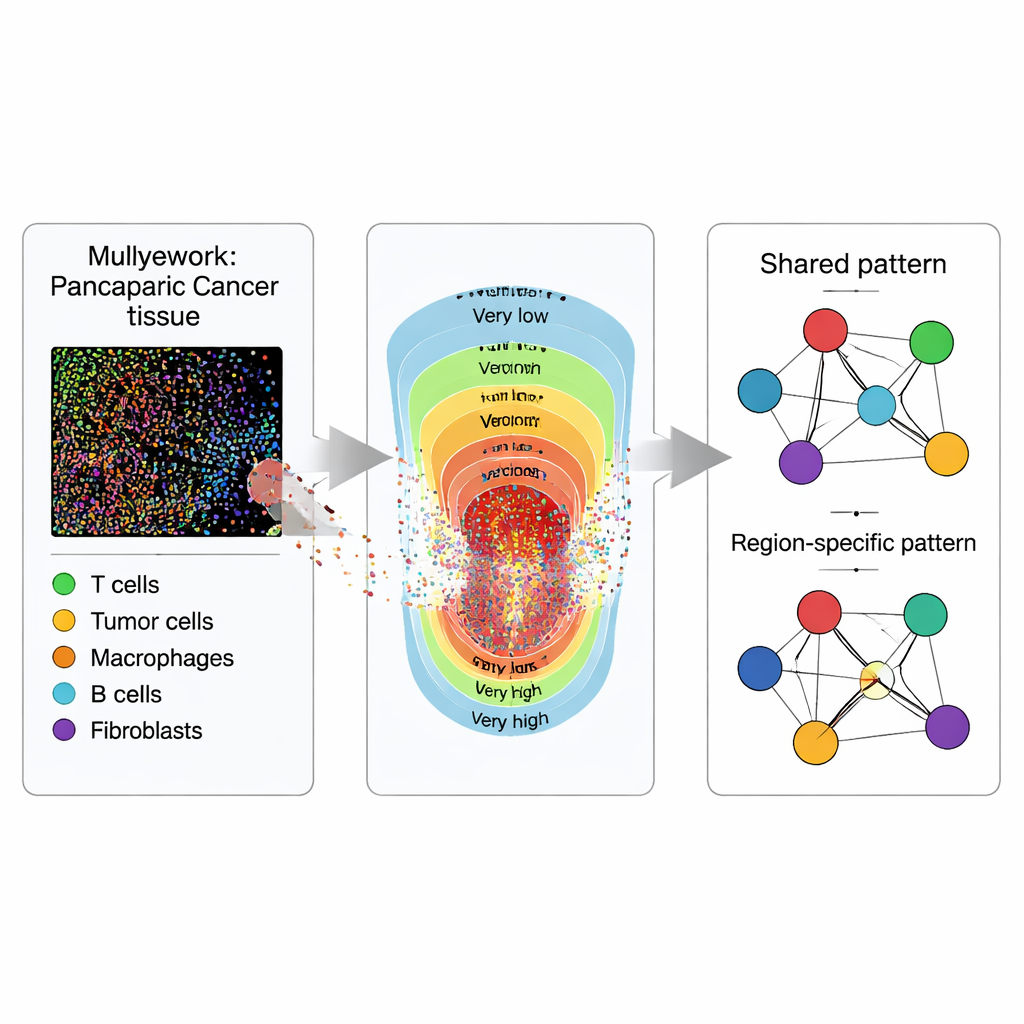
Rather than treating a tumor slice as a flat image, the researchers treat it like a map full of points. Using multiplexed immunofluorescence imaging, they stain tissue samples from 119 PDAC and 53 IPMN patients so that different types of cells glow in distinct colors. Specialized software turns every visible cell into a dot with coordinates and a label: tumor (epithelial) cells, several flavors of T cells that can attack or regulate immune responses, and antigen-presenting cells that show tumor fragments to T cells. The key question is not just how many of each cell are present, but where they are relative to one another across the tissue.
Dividing the Tumor into Zones
To capture how tumors change from the center outwards, each tissue sample is divided into five zones based on how densely packed the tumor cells are, from “very low” to “very high” tumor intensity. These zones represent a gradient of tumor burden and cellular crowding that pathologists often see under the microscope but rarely quantify. Within each zone, the team estimates smoothed “intensity maps” for each cell type, essentially turning scattered dots into continuous heat maps of where each cell type tends to cluster. This zoning lets them compare not only how cells interact overall, but how those interactions shift from sparse to dense tumor regions.
Turning Cell Neighborhoods into Networks
Next, the researchers translate the spatial patterns into networks, where each cell type is a node and links represent how strongly two cell types tend to appear together after accounting for all the others. Using a Bayesian statistical framework they call ISPat (Informed Spatially aware Patterns), they separate features that are shared across all zones from those that are zone-specific. ISPat can also plug in prior biological knowledge when available, helping stabilize estimates in complex data. Simulation experiments show that ISPat can reliably recover known patterns and does so far faster than traditional methods, making it practical for large imaging studies.
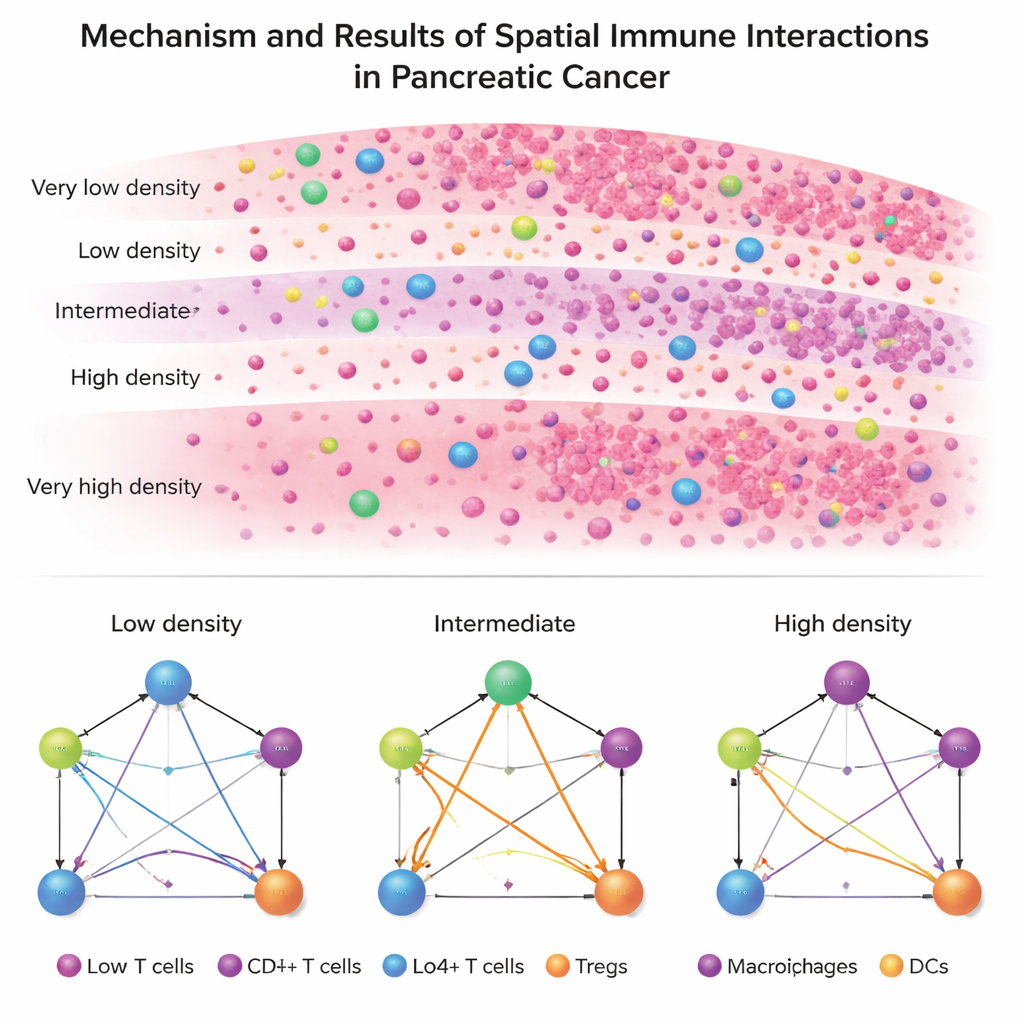
Two Diseases, Two Immune Architectures
When they apply ISPat to real patient data, a striking contrast emerges between PDAC and IPMN. PDAC displays a rigid, uniform immune architecture: across almost all zones, tumor cells, helper T cells, killer (cytotoxic) T cells, regulatory T cells, and antigen-presenting cells maintain nearly the same pattern of relationships. This suggests a stable, entrenched immunosuppressive environment that is hard to dislodge. By contrast, IPMN shows far more variation from zone to zone, especially in how regulatory T cells connect with other immune cells. In IPMN, intermediate-density zones—neither completely packed with tumor cells nor nearly tumor-free—show the most dramatic reshaping of immune interactions.
Hotspots for Immune Evasion and Therapy
Digging deeper, the study identifies specific pairs of cell types whose interactions consistently differ between PDAC and IPMN, particularly in those intermediate-density zones. Many of these involve regulatory T cells, which can dial down immune attacks, and antigen-presenting cells and killer T cells, which launch and execute anti-tumor responses. Notably, interactions that drive antigen presentation and direct tumor killing, as well as those that enforce immune suppression, diverge most sharply in these mid-gradient areas, not in the most extreme tumor regions. This pattern suggests that the crucial battleground for immune control lies in transitional zones where the tumor and immune system are still actively negotiating.
What This Means for Patients
For a non-specialist, the takeaway is that where cells sit in a tumor matters as much as which cells are there. PDAC appears to lock in a stable, suppressive immune “layout,” while IPMN’s immune landscape remains more flexible and region-dependent. These spatial fingerprints could become biomarkers to distinguish dangerous tumors from precancerous lesions and to predict which patients might benefit from particular immunotherapies. The ISPat framework offers a general tool to read such spatial codes in many diseases, supporting a future in which cancer treatment is guided not only by genetics and cell types, but by the fine-grained geography of cells within each patient’s tumor.
Citation: Bhadury, S., Peruzzi, M., Acharyya, S. et al. Informed spatially aware patterns for multiplexed immunofluorescence data. Sci Rep 16, 5015 (2026). https://doi.org/10.1038/s41598-026-35341-8
Keywords: pancreatic cancer, tumor microenvironment, spatial imaging, immune interactions, precision oncology