Clear Sky Science · en
GIS-based assessment of land degradation vulnerability and environmental indices as ecological indicators in Western Agro-climatic zone of Tamil Nadu, India
Why the health of this landscape matters
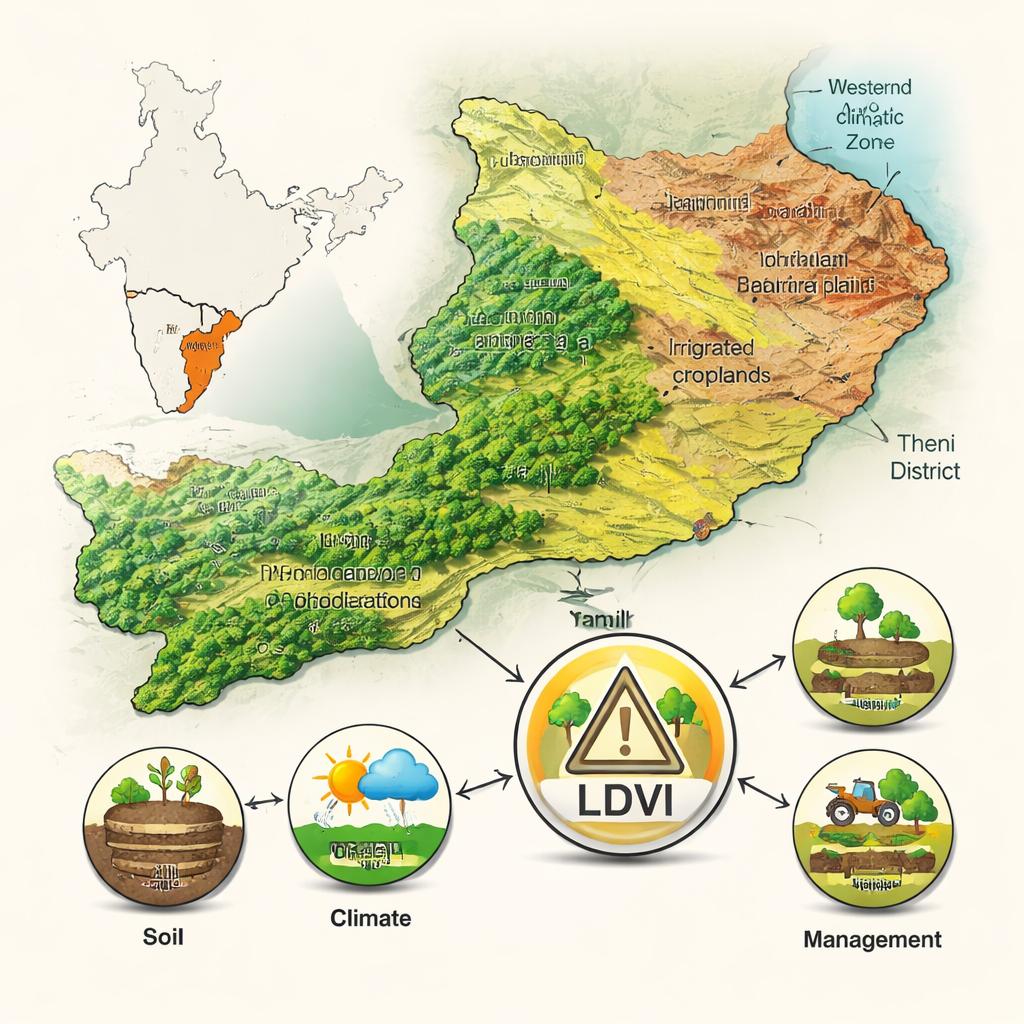
Across the world, once-productive farmland is turning into tired, crusted soil that yields less food each year. This article looks closely at one such region: the western agro‑climatic zone of Theni District in Tamil Nadu, India. Using satellite images and digital maps, the researchers track where the land is still healthy, where it is beginning to struggle, and where it is already in serious trouble. Because this region feeds large rural communities and faces a changing monsoon climate, its fate offers a preview of how food security and land stewardship are intertwined in many parts of the Global South.
Taking the pulse of the land
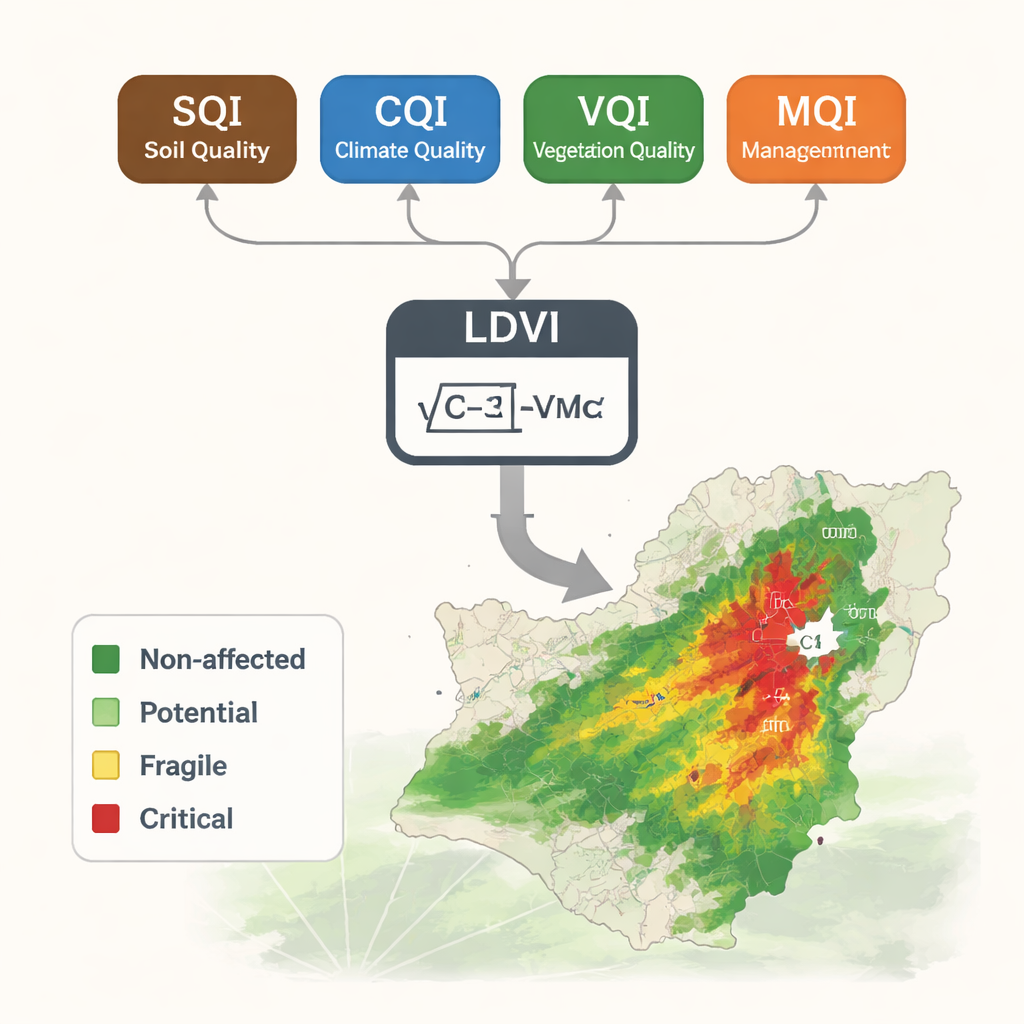
The team’s central goal is to measure how vulnerable different parts of Theni District are to land degradation—a gradual decline in soil and vegetation that can eventually resemble desertification. They build a Land Degradation Vulnerability Index (LDVI) that works like a health score for every 30‑by‑30‑meter patch of ground. Rather than rely on a single factor, the LDVI combines four kinds of information: soil conditions, local climate, vegetation health, and how people use and manage the land. By weaving these layers together in a geographic information system (GIS), they can see which combinations of slope, soil, rainfall, crops, and management practices push land toward decline.
Four windows into land health
Each of the four "quality indices" captures a different stress on the landscape. The Soil Quality Index reflects texture, depth, drainage, and the underlying rock, all of which determine how well soil holds water and nutrients. The Climate Quality Index blends rainfall, dryness, and atmospheric demand for water; it highlights areas where high evaporation and patchy rain leave fields parched. The Vegetation Quality Index uses satellite‑derived greenness, plus indicators of resistance to drought, fire, and erosion, to show where plants can still shield the soil. Finally, the Management Quality Index links land‑use type and land capability, distinguishing well‑managed forests and irrigated fields from poorly managed dry cropland, fallows, and barren tracts. Together, these indices show that shallow, stony soils, harsh dry conditions, sparse vegetation, and careless farming practices tend to cluster in the same vulnerable places.
Mapping safe, fragile, and critical zones
When the four indices are combined into the LDVI, a clear pattern emerges across the 2,869 square‑kilometer study area. About 13 percent of the land falls into a "non‑affected" group—mostly forests, plantations, and well‑irrigated croplands with deep, better‑drained soils and relatively favorable climate. Another 13 percent is classed as "potential" land, still functioning reasonably well but at risk if climate extremes or poor management intensify. The largest share, roughly 44 percent, is labeled "fragile"; these are mid‑range zones where cropland, fallows, and shrubland on alluvial plains and foothills are already showing signs of stress and can slide quickly toward degradation. Most alarming, just over a quarter of the district lies in the "critical" classes, including a small but severe C3 category where the index signals very high degradation. These critical hotspots cluster on pediplains, barrens, and fallow fields, especially around the Vaigai reservoir and central and northeastern plains.
What drives the downward spiral
Statistical tests reveal that soil condition and vegetation health are the strongest companions of land degradation in this region. Where soils are shallow, poorly drained, or easily eroded, the LDVI rises sharply. Where satellite data show thinning or moisture‑stressed vegetation, vulnerability also climbs, indicating that plants are both victims and buffers of degradation. Management plays a major role as well: roughly half the district’s cultivable land falls into intermediate quality for management, suggesting that common practices—such as leaving fields bare, over‑working marginal slopes, or neglecting erosion control—are quietly undermining long‑term productivity. Climate factors, such as increasing aridity and high evaporative demand, tend to amplify these pressures, especially on unirrigated fields and fallow lands.
Reading the warning—and the opportunity
For non‑specialists, the take‑home message is stark but hopeful. In Theni District, more than one in four hectares is already in serious trouble, and nearly half is teetering on the edge. Yet the same mapping tools that reveal this risk also point to practical remedies. Protecting and enriching soils, maintaining continuous vegetative cover, improving irrigation and drainage, and matching crops to the true capacity of the land can all push LDVI scores downward, back toward health. By tying its analysis to global goals on hunger and climate action, the study shows how careful monitoring of land, water, and vegetation can guide local decisions that keep farms productive, landscapes resilient, and communities more secure in the face of a warming, less predictable climate.
Citation: Kaliraj, S., Joe, R.J.J., Pitchaimani, V.S. et al. GIS-based assessment of land degradation vulnerability and environmental indices as ecological indicators in Western Agro-climatic zone of Tamil Nadu, India. Sci Rep 16, 4944 (2026). https://doi.org/10.1038/s41598-026-35211-3
Keywords: land degradation, GIS mapping, soil and water conservation, remote sensing, Tamil Nadu agriculture