Clear Sky Science · en
Estimation and spatial distribution of soil organic carbon content in farmland using unmanned aerial vehicle hyperspectral remote sensing technology
Why the carbon in our soil matters
Soil is far more than dirt under our feet. It stores huge amounts of carbon, feeds our crops, and helps buffer climate change by soaking up carbon dioxide from the air. But the amount of organic carbon in soil can change quickly from one part of a field to another, and traditional lab tests are slow and costly. This study explores a faster, high-tech way to "see" soil organic carbon from above using small drones equipped with hyperspectral cameras, offering farmers and scientists a powerful new tool for managing land and climate.
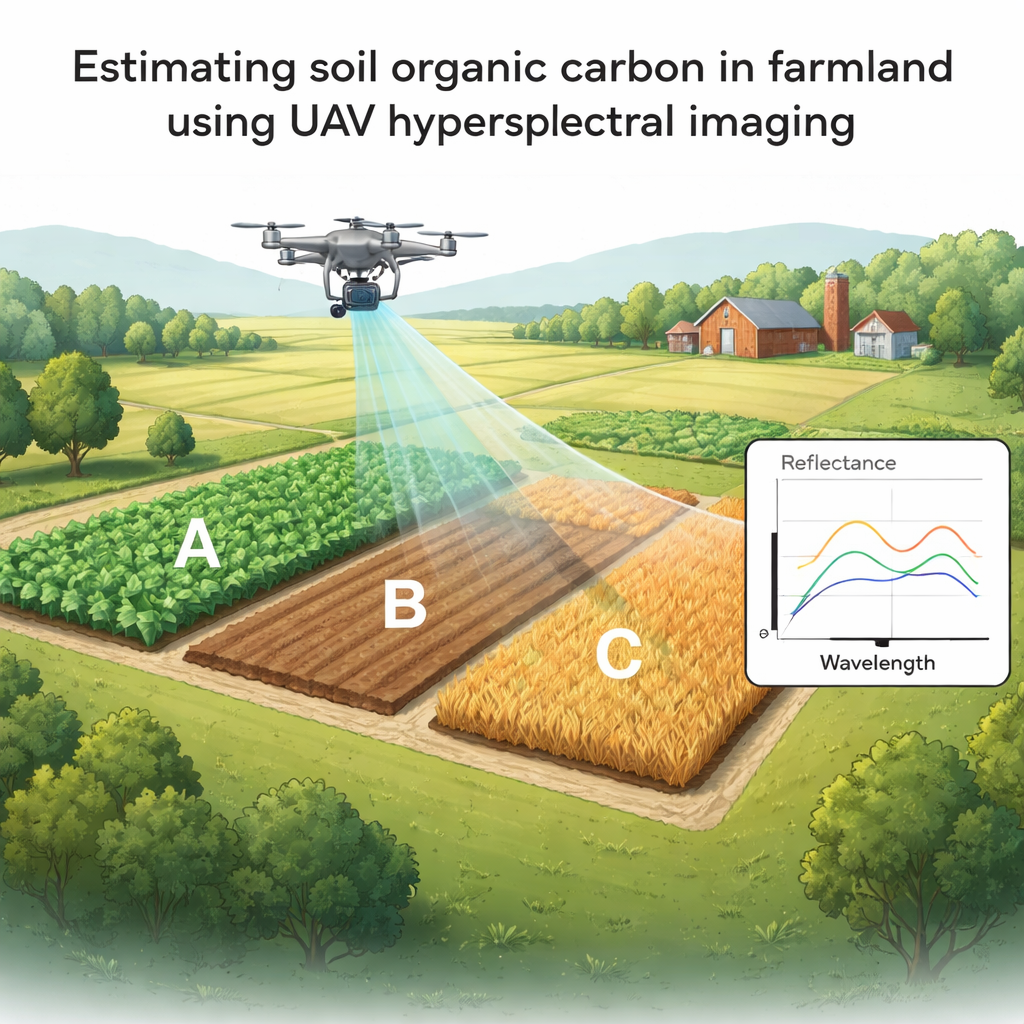
Flying cameras over fields
The researchers worked in three farmland areas in the Huangshui River Basin of Qinghai Province in China, a region with different soil types, crops, and farming practices. They used a multirotor drone carrying a hyperspectral camera that measures light in 150 narrow color bands from visible to near-infrared. Flying at about 150 meters on clear, calm days, the drone collected very detailed images, with each pixel representing less than five centimeters on the ground. These images capture subtle differences in how soil reflects light that are linked to how much organic carbon the soil contains.
Digging, testing, and matching ground truth
To check what the drone was seeing, the team collected 296 soil samples from the three fields using a grid pattern and careful depth control (0–20 centimeters, where carbon changes most). In the lab, they removed stones and plant pieces, finely ground the soil, and used an elemental analyzer to measure organic carbon content accurately. They also measured soil spectra indoors with a precise spectrometer, then adjusted those spectra to match the wavelength range and detail of the drone sensor. This allowed them to link exact carbon measurements from the lab with matching spectral signatures from both ground instruments and the airborne images.
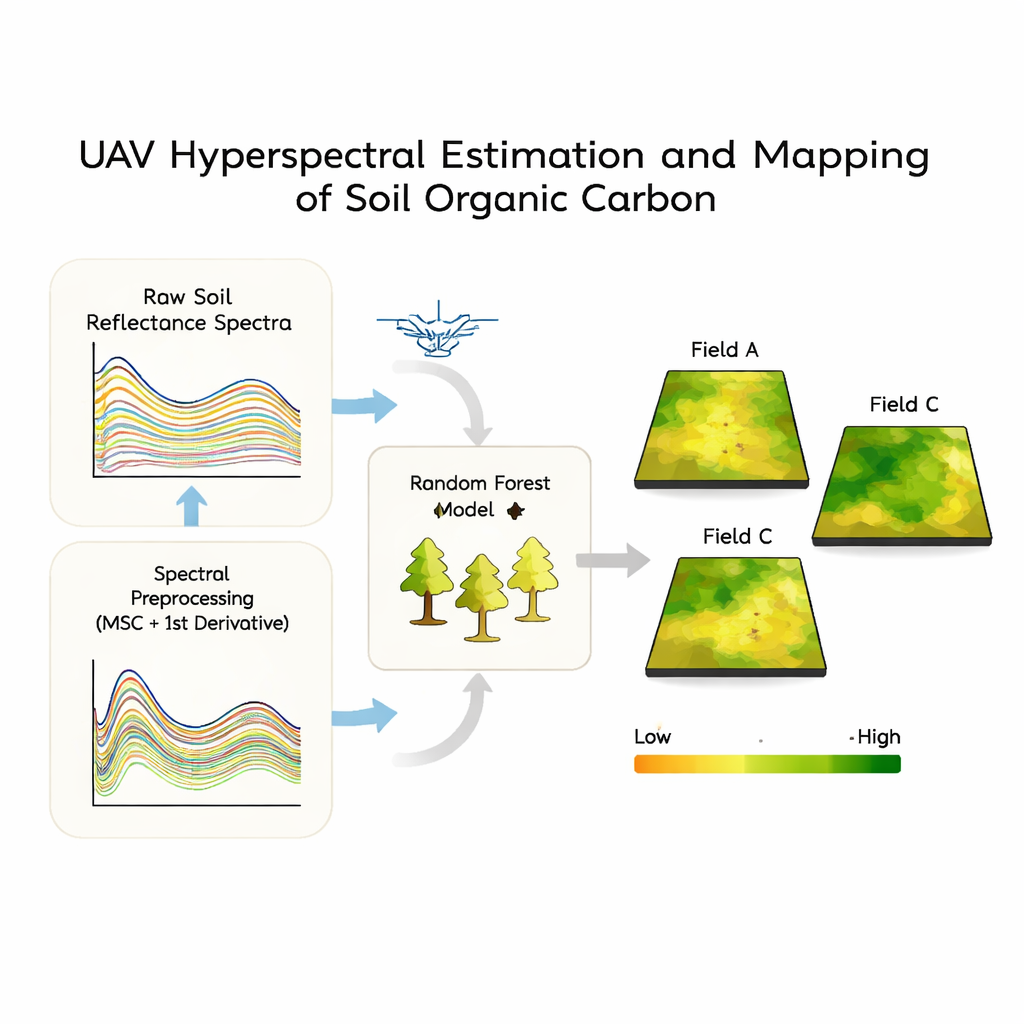
Cleaning up the signal and teaching the model
Raw spectral data can be messy because many things besides carbon—such as soil moisture, surface roughness, and particle size—affect how light is reflected. To tackle this, the researchers tested seven different mathematical treatments of the spectra. The best approach combined a method called multiplicative scatter correction, which reduces brightness distortions, with a first derivative operation, which highlights subtle dips and peaks in the curves. This combination produced the strongest link between spectral features and soil carbon. They then compared five modeling methods, from simple linear equations to advanced machine-learning techniques. The random forest model, which builds many decision trees and averages them, clearly performed best, explaining about 90% of the variation in soil organic carbon and achieving high prediction quality.
Turning light into detailed soil maps
With the best spectral treatment and the random forest model in hand, the team applied their approach to the full drone images to create detailed maps of soil organic carbon across each field. The model highlighted specific color bands as most important, especially in the visible range (where darker soils often mean more carbon) and in the near-infrared (where organic matter affects light absorption). The resulting maps showed clear patterns: one field was dominated by high carbon levels, another by medium levels, and the third mainly by lower levels. When the researchers compared the drone-based estimates at sampling points with the lab measurements, the match was strong, confirming that the maps were reliable.
What this means for farming and climate
In plain terms, this study shows that a drone with a smart camera and a well-trained model can quickly create accurate, fine-scale maps of soil organic carbon, instead of relying only on time-consuming soil sampling and lab work. Farmers and land managers could use such maps to target fertilizer and residue management, protect areas at risk of carbon loss, and monitor how soil health changes over time. While the method still faces challenges—such as sensitivity to soil moisture, surface residues, and changing light—it points toward a future where monitoring the carbon wealth beneath our fields becomes faster, cheaper, and far more detailed, helping both food production and climate goals.
Citation: Song, Q., Zhang, W. Estimation and spatial distribution of soil organic carbon content in farmland using unmanned aerial vehicle hyperspectral remote sensing technology. Sci Rep 16, 5480 (2026). https://doi.org/10.1038/s41598-026-35096-2
Keywords: soil organic carbon, UAV hyperspectral, precision agriculture, soil mapping, remote sensing