Clear Sky Science · en
Grey Wolf optimization enhanced adaptive decomposition for trend periodic analysis of nonstationary and nonlinear hyrologic series
Why this matters for water and climate
As climate change and human activities reshape weather patterns, the timing and amount of river flow are becoming less predictable. This paper introduces a new way to tease out long‑term trends and natural cycles hidden inside noisy water and climate records. The method helps reveal how quickly a region is warming, whether droughts are becoming more frequent, and when the next spell of unusually low river flow might arrive—knowledge that matters for drinking water security, hydropower, farming, and flood and drought preparedness.
A smarter way to read noisy river records
Hydrological records such as rainfall, temperature, and river runoff rarely behave in a simple, steady way. They jump around, show long memories of past conditions, and often break the assumptions behind many classic statistical tools. Traditional methods, like straight‑line trend fitting or non‑parametric rank tests, usually assume the data are roughly independent and follow familiar probability shapes. Likewise, common tools for finding repeating cycles, such as the Fast Fourier Transform or wavelet analysis, can miss important signals when the data are highly irregular. The authors address these weaknesses by building a combined trend‑and‑cycle analysis framework, called GITPA, that is designed specifically for messy, changing environmental data.
How the new method hunts for patterns
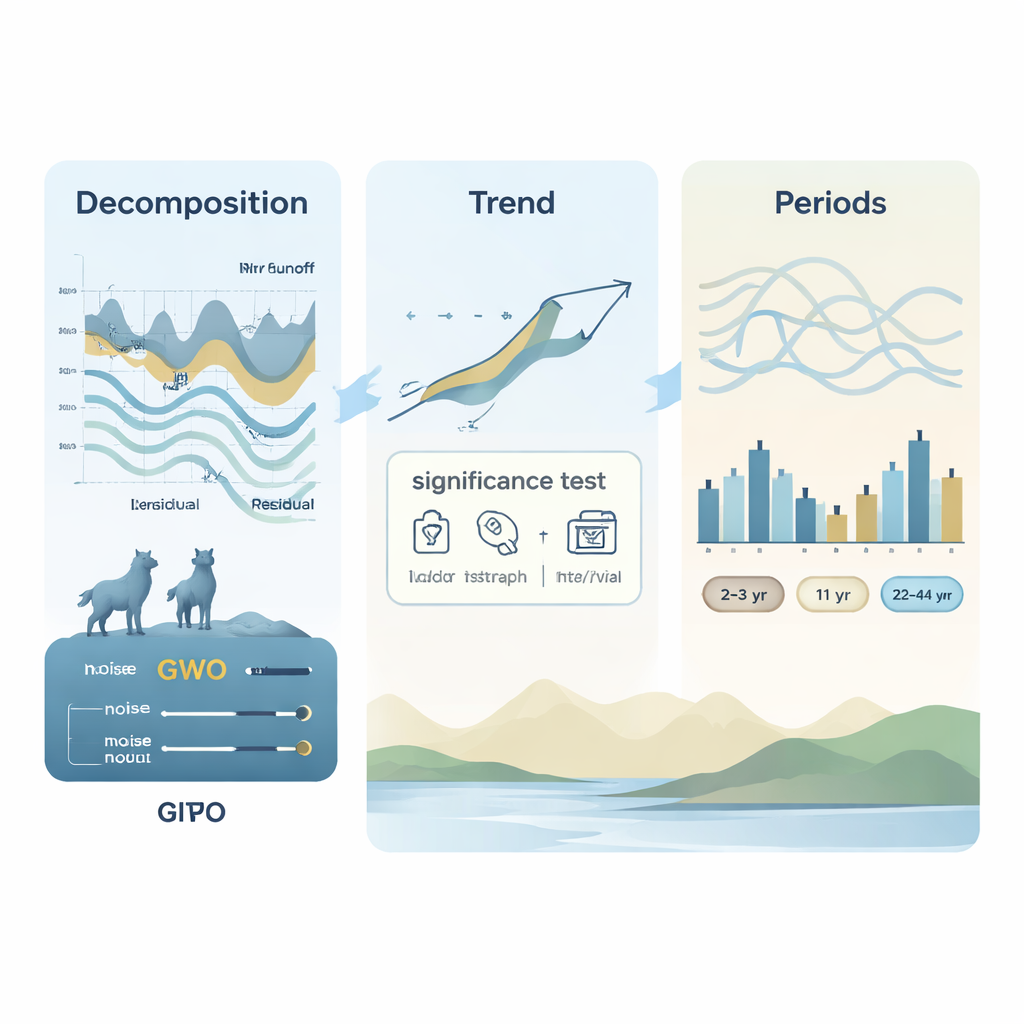
At the heart of GITPA is a modern signal‑processing technique called ICEEMDAN, which breaks a time series into several component waves plus a background trend. The challenge is that this decomposition depends on delicate settings that can blur or mix the signals. To solve this, the authors use a nature‑inspired search routine, the Grey Wolf Optimizer, to automatically tune two key noise parameters so that the decomposed pieces show clear, regular behavior. Once the series has been split into smooth parts, low‑frequency components are combined to form a trend curve, while higher‑frequency components feed a spectral analysis that reveals dominant cycles. A statistical t‑test helps distinguish genuine low‑frequency behavior from random noise, and a bootstrap resampling scheme provides confidence intervals without assuming any specific probability shape.
Putting the technique to the test
Before turning to real rivers, the authors create hundreds of artificial time series with controlled properties: short and long records, weak and strong trends, different probability distributions, and various levels of memory from one year to the next. They then compare their GITPA approach with several widely used methods, including the Mann–Kendall test, innovative trend analysis, and wavelet‑based tools. Across a wide range of conditions, the new method detects subtle trends more reliably, especially in short records or when trends are weak. Its accuracy generally exceeds 85%, and it proves far less sensitive to the exact distribution of values or the degree of autocorrelation. For periodic behavior, GITPA successfully recovers all the imposed cycles—even when two periods overlap—whereas traditional wavelet analysis often misses longer cycles or misidentifies them.
What the Yangtze River can tell us
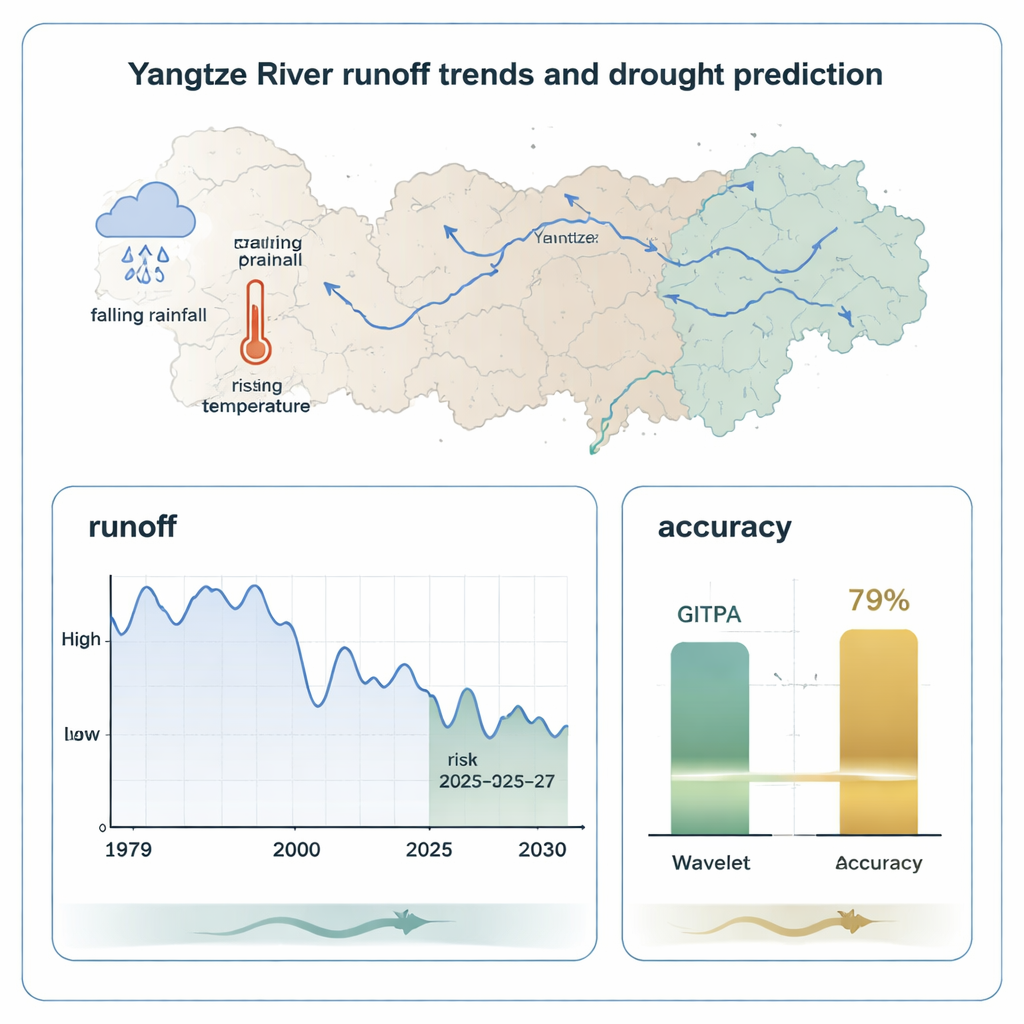
The researchers then apply their framework to 44 years of data from China’s Yangtze River Basin, a region that supplies over a third of the country’s water and supports about 40% of its economic output. By separating trend and cycle components in temperature, rainfall, and runoff at key stations, they confirm a clear warming of about 0.03 °C per year basin‑wide. Rainfall and river flow show a more complex picture: precipitation tends to rise in the northwest and northeast parts of the basin, but decline in central and southwestern areas, and most tributaries and the main stem exhibit falling runoff. The analysis also uncovers recurring patterns: short cycles of about 2–3 years, a medium cycle near 11 years, and longer swings of 22–44 years. These timescales line up with known climate and solar rhythms, including El Niño–Southern Oscillation, Indian Ocean temperature modes, and solar activity cycles.
Looking ahead to future drought risk
By reconstructing the Yangtze’s flow as a combination of its underlying trend and these recurring cycles, the authors extend the patterns into the near future. Their extrapolation focuses on identifying high‑ and low‑flow years rather than precise volumes. When tested retrospectively, their method correctly classifies wet and dry conditions nearly 80% of the time, substantially outperforming a common wavelet‑based approach. Pushing the analysis forward suggests an elevated chance of unusually low runoff in the mid‑2020s, particularly around 2025–2027. For a basin as economically and socially critical as the Yangtze, this kind of early warning underscores the value of tools that can untangle hidden structure in complex environmental records and support more resilient water‑management decisions.
Citation: Li, J., Ding, W. & Wang, H. Grey Wolf optimization enhanced adaptive decomposition for trend periodic analysis of nonstationary and nonlinear hyrologic series. Sci Rep 16, 4839 (2026). https://doi.org/10.1038/s41598-026-35076-6
Keywords: hydrologic time series, trend and cycle analysis, Yangtze River, drought prediction, climate variability