Clear Sky Science · en
Comparative analysis of machine learning models with SHAP interpretation for causes of highway flood-damage blocking
Why flooded highways matter to everyday life
When heavy rain washes out a road or triggers a landslide, it can strand travelers, delay emergency services, and disrupt the flow of food and goods. In China’s Sichuan Province, such flood-related highway blockages have become increasingly common as extreme weather intensifies and the road network grows. This study asks a practical question with global relevance: can modern artificial intelligence help predict when and where highways are most likely to be cut off by floods, and can it explain why?
Mapping a vulnerable mountain region
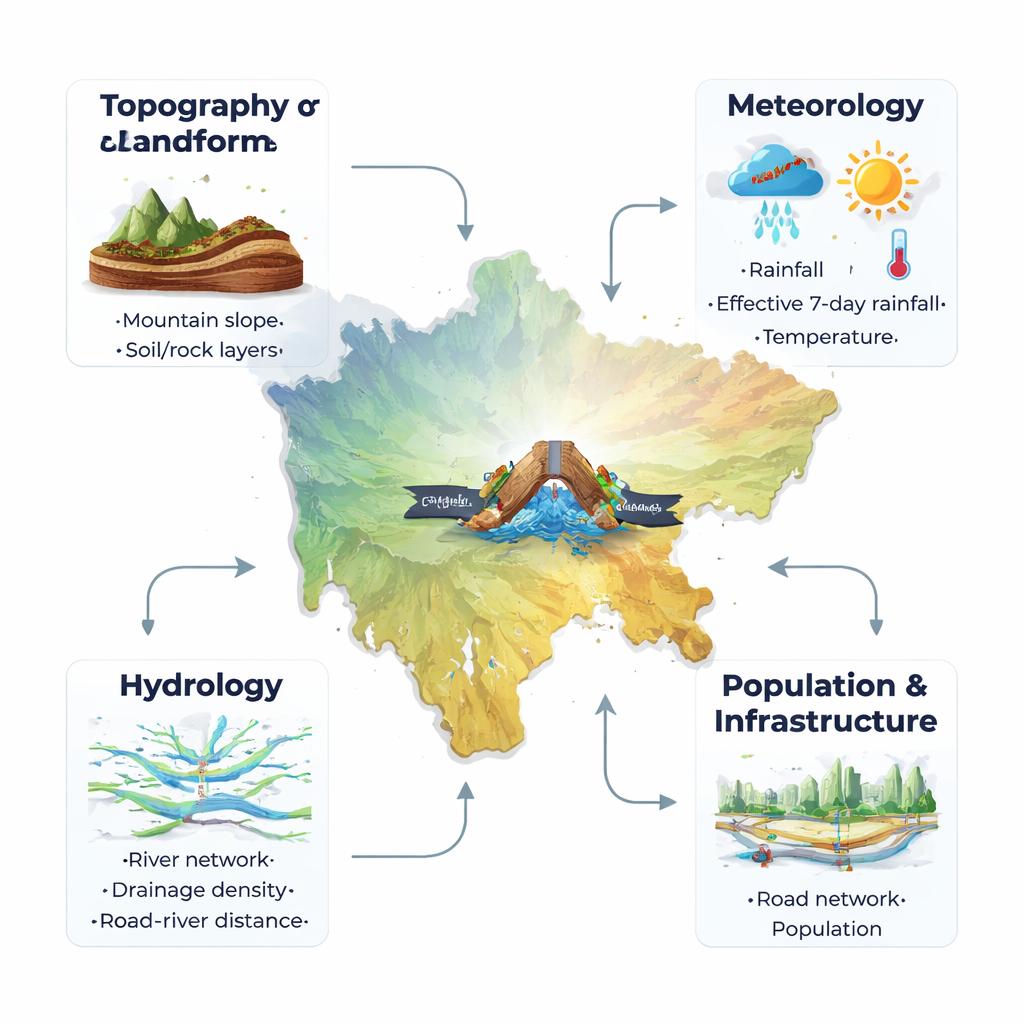
Sichuan, a vast province in southwestern China, was chosen as a testbed because it combines sprawling road networks with rugged terrain and intense seasonal rains. The researchers gathered a rich set of information for 2021–2022, including nearly 9,000 daily records of flood-related highway blockages, elevation and slope from satellite data, vegetation cover, land use, rivers and streams, rainfall and temperature, and population and road density. They focused on major roads—highways, national, and provincial routes—where closures cause the greatest social and economic disruption. To keep the data realistic, they worked with a common challenge: days with no blockage events greatly outnumbered days when roads were actually cut off.
Teaching machines to spot trouble ahead
The team built an integrated framework that links three ideas: smarter handling of rare events, careful comparison of prediction methods, and transparent explanations of what drives risk. Because blockage events are relatively rare, traditional models tend to “learn” mostly from the many safe days and fail to recognize the dangerous few. To counter this imbalance, the researchers compared three strategies. One simply removed some non-blockage days (undersampling). A second used a technique called TimeGAN, which learns the patterns in real time series and then generates realistic synthetic examples of rare blockage days to boost the minority class. A third hybrid approach combined both ideas. On top of these preprocessed datasets, they trained six different machine-learning models, from familiar approaches like logistic regression and support vector machines to more flexible methods such as random forests, gradient boosting, and multilayer perceptrons (a type of neural network). Performance was judged mainly by how well each model balanced catching true blockage events while avoiding false alarms.
Finding the best predictor and testing its reliability
Across dozens of model and data combinations, one pairing stood out: a multilayer perceptron trained on TimeGAN-augmented data. This configuration achieved the highest F1 score (about 50%) and competitive precision–recall performance, meaning it did the best job identifying blockage days without being overwhelmed by false positives. Importantly, the model’s scores on unseen test data closely matched its scores during training, and a special bootstrap test that reshuffled time-ordered blocks showed that its performance was stable rather than a fluke. In other words, creating realistic extra examples of rare blockage events helped the neural network learn useful patterns without overfitting to noise.
What the model reveals about risky conditions
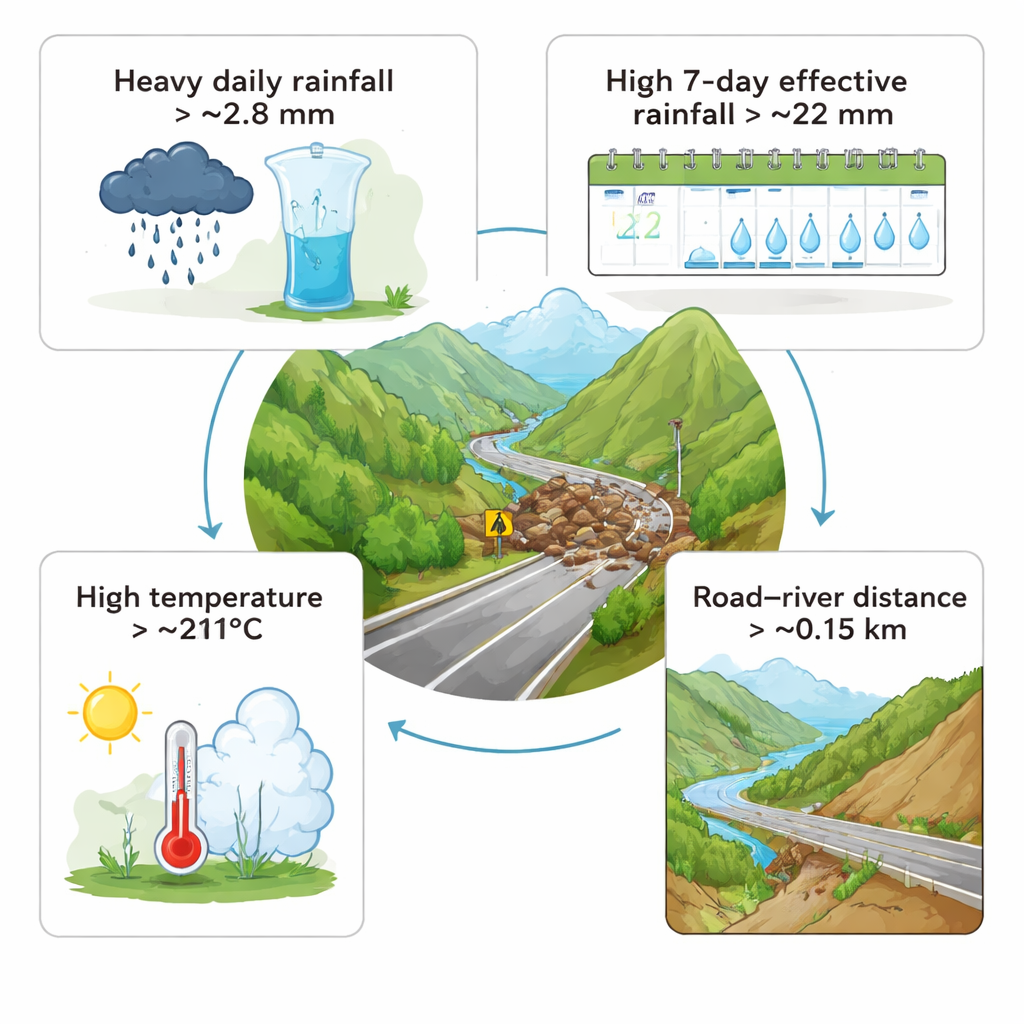
To move beyond “black box” predictions, the authors used a method called SHAP to probe the trained neural network and ask which factors mattered most and how. The analysis highlighted a small set of weather and location thresholds that sharply increase blockage risk. Daily rainfall above about 2.8 millimeters and a seven-day buildup of effective rainfall above about 22 millimeters both mark turning points: below these levels, conditions tend to suppress blockages; above them, the odds rise quickly as soils saturate and runoff scours slopes and roadbeds. Temperature plays a similar role. When average daily temperatures stay below roughly 21 degrees Celsius, risk is generally low, but warmer conditions often coincide with heavier, more intense rain and wetter ground, together feeding more landslides and washouts. A less obvious factor is how far a road sits from the nearest stream. When the average road–river distance within a one-kilometer band exceeds about 0.15 kilometers, risk rises, likely because such roads tend to lie on steeper, more failure-prone hillsides instead of gentler valley floors.
Turning insight into safer roads
For non-specialists, the core message is straightforward: certain combinations of “too much water, for too long, in the wrong terrain” substantially increase the chances that a highway will be blocked. By pinpointing rainfall, temperature, and road–river distance thresholds, and by showing that a carefully tuned neural network can anticipate risky days with reasonable accuracy, the study offers practical guidance for road managers. These insights can feed into early-warning dashboards, guide where to reinforce slopes or drainage, and help prioritize segments of long highway networks for monitoring and maintenance. As extreme weather becomes more common, such data-driven, explainable tools could play a key role in keeping critical transport routes open and communities connected.
Citation: Li, B., Wu, L., Gao, J. et al. Comparative analysis of machine learning models with SHAP interpretation for causes of highway flood-damage blocking. Sci Rep 16, 5118 (2026). https://doi.org/10.1038/s41598-026-35074-8
Keywords: highway flood risk, machine learning, extreme rainfall, infrastructure resilience, landslides