Clear Sky Science · en
Times series InSAR deformation monitoring of Jinchuan mining area based on mini stack technology
Watching the Ground Sink from Space
Modern cities, mines, and infrastructure quietly rise and fall as the ground beneath them shifts. In China’s Jinchuan mining area—one of the world’s major nickel and cobalt sources—years of excavation have slowly reshaped the land, threatening tunnels, buildings, and roads. This study shows how scientists can now track those subtle movements over many years using radar satellites and a smarter way of handling enormous volumes of data, offering a new tool to keep mining regions and nearby communities safer.
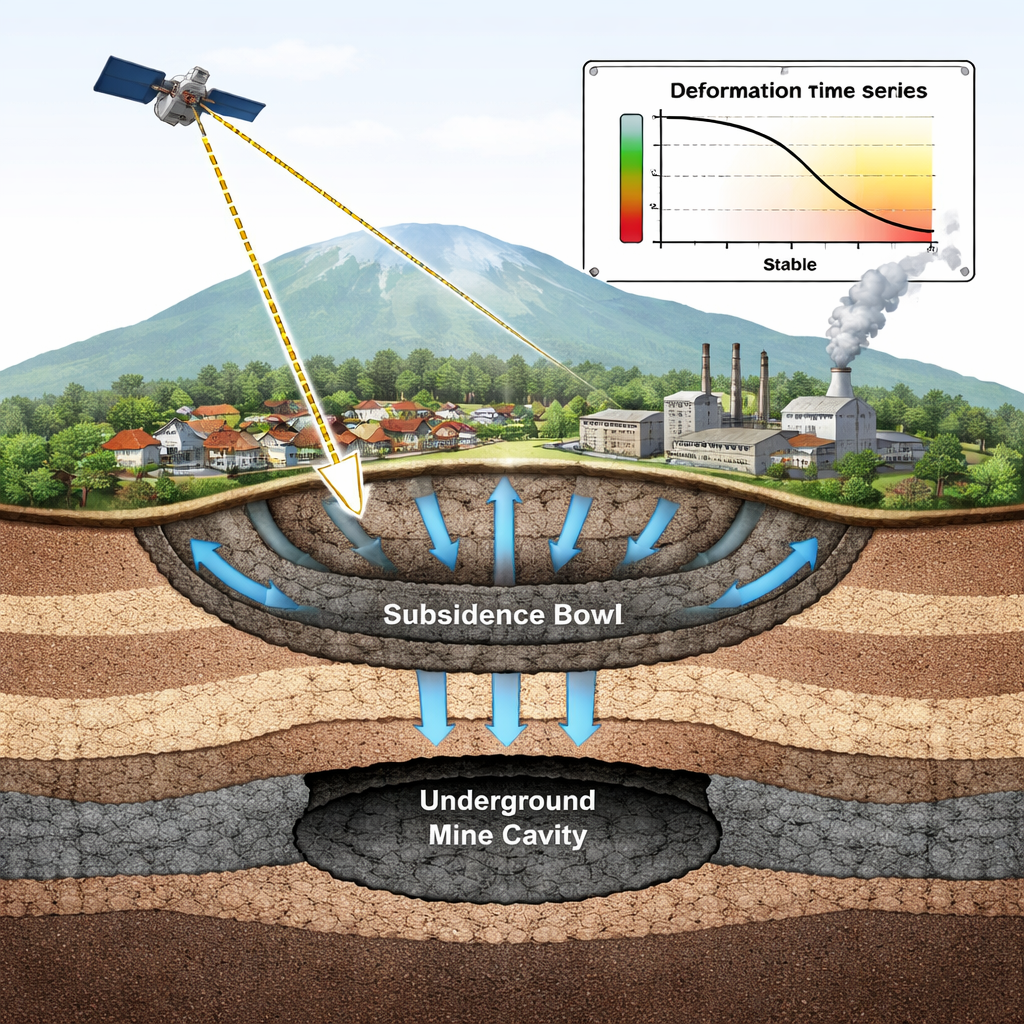
Why the Land Around Mines Keeps Moving
When minerals are dug out from deep underground, the overlying rock no longer has solid support. Over time, the rock layers sag, crack, and sometimes collapse, gradually pulling the ground surface down. In the Jinchuan mining area, this problem is made worse by weak rock types, loose soil, and heavy metal pollution that has already damaged the local environment. Traditional monitoring methods—such as ground survey lines, GPS stations, or drone flights—can be very accurate at specific points, but they are costly, slow, and difficult to use safely above unstable ground. They also cannot easily provide a continuous picture over dozens of square kilometers or track changes over many years.
Satellites That Measure Millimeters
Interferometric Synthetic Aperture Radar (InSAR) offers a way around these limits. Radar satellites like Europe’s Sentinel‑1A repeatedly scan the same area from orbit, and by comparing the phase of the radar signals between pairs of images, scientists can detect ground motion at the millimeter-per-year level. However, this power comes at a cost: after a decade in orbit, Sentinel‑1 has produced vast archives of images, and using all of them in time‑series analysis pushes even modern computers to their limits. When hundreds of images are combined, small errors and random noise can also build up, especially in natural areas with vegetation or bare soil, reducing the clarity of the final deformation map.
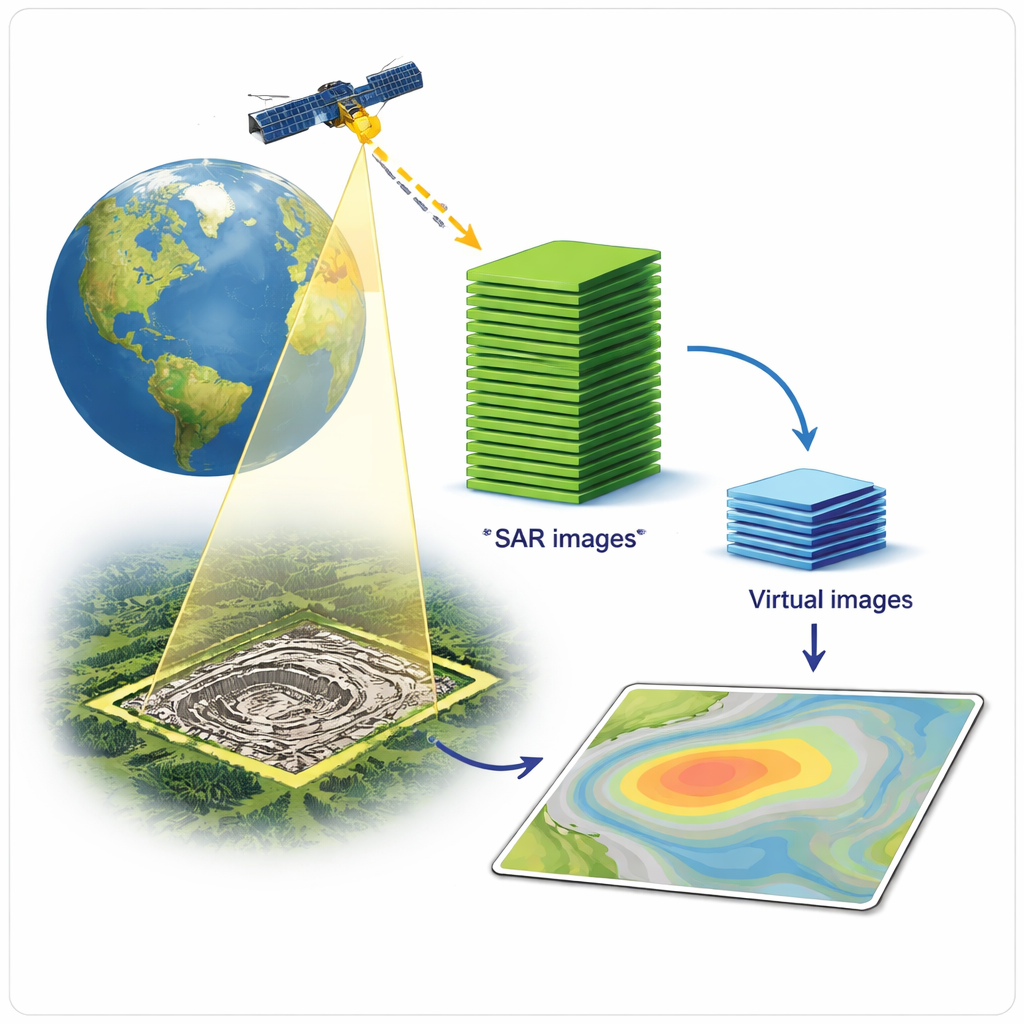
Shrinking Hundreds of Images into a Few
The authors tackled this challenge by borrowing ideas from data compression. Instead of analyzing all 199 radar images from 2017 to 2024 directly, they grouped images taken close in time and used mathematical tools to describe how strongly each image in a group resembles the others. From this, they built a so‑called covariance matrix and used an approach called eigenvalue decomposition to identify the main pattern that the images share. That pattern is used to construct a single “virtual image” that preserves the meaningful deformation signal while discarding a large amount of redundant noise. After doing this for all the groups, 199 original images shrank to just 22 virtual images—a technique the authors call “mini stack” processing—while still covering the whole seven‑year period.
Sharper Vision of a Sinking Mine
These 22 virtual images were then fed into a standard InSAR processing pipeline to estimate how the ground moved over time. Compared with results from the full, uncompressed data, the compressed approach produced interferograms—special radar difference images—with cleaner, smoother patterns and less random speckle. On average, the clarity (measured by a coherence index) improved by about one‑third, while a measure of unwanted phase jumps dropped by nearly one‑fifth. Most strikingly, the number of reliable monitoring points within the mining zone increased more than 30‑fold, revealing detailed subsidence features that were almost invisible before. Yet when the researchers compared the final deformation rates from compressed and original data, they matched extremely well, differing on average by just 0.01 millimeters per year. Checks against four ground‑based GPS stations also showed that the satellite‑derived curves tracked real‑world motion closely.
What the Ground Is Telling Us
The enhanced maps show how parts of the Jinchuan mining area have been slowly sinking over several years. From 2018 onward, a pronounced “subsidence funnel” deepened above the main ore bodies, spreading east and west and reaching a maximum total drop of about 10 centimeters by 2024. Points located in surrounding mountains and residential districts remained almost stable, while those closer to the mine and industrial facilities showed steadily increasing downward motion. Field photographs of cracked tunnels and distorted underground supports confirm that the radar‑observed patterns reflect real and serious structural damage underground.
A New Tool for Safer Long‑Term Mining
For non‑specialists, the takeaway is straightforward: by compressing long radar image records into a much smaller, cleaner set of virtual images, scientists can monitor subtle ground sinking over many years more efficiently and more accurately. In the Jinchuan mine, this mini stack approach sharply reduces computing demands while preserving—indeed improving—the ability to spot dangerous subsidence zones before they cause disasters. The same strategy can be extended to other mining districts, cities, and infrastructure corridors worldwide, turning the constant stream of satellite radar data into a practical early‑warning system for slow but hazardous changes in the Earth’s surface.
Citation: Guo, J., Zhang, G., Song, Y. et al. Times series InSAR deformation monitoring of Jinchuan mining area based on mini stack technology. Sci Rep 16, 5327 (2026). https://doi.org/10.1038/s41598-026-35018-2
Keywords: ground subsidence, radar satellite monitoring, mining deformation, time series InSAR, remote sensing of hazards