Clear Sky Science · en
Combining multimodal fatigue fracture surface images for analysis with a CNN
Why tiny cracks matter
Everyday technologies—from jet engines to medical implants—depend on metal parts that can survive millions of load cycles without suddenly breaking. Yet most engineering failures still begin as small, almost invisible cracks that slowly grow until catastrophe strikes. This paper explores how to read the “fingerprints” those cracks leave behind on fractured metal surfaces, and how combining different kinds of microscope images with modern artificial intelligence can turn those fingerprints into early warnings about how and why a part failed.
Looking at broken metal in new ways
When a metal part breaks from repeated loading, the exposed surface is far from smooth. It is covered with patterns—ridges, valleys, and textures—that record how the crack initiated and grew. Traditionally, trained experts inspect these fracture surfaces by eye using powerful microscopes, relying on experience to interpret what they see. The authors focus on a widely used titanium alloy, Ti-6Al-4V, common in aerospace components. They ask whether computers can learn to read these complex surfaces, not just to label how they broke, but to estimate practical quantities such as how fast a crack was growing and how far it is from the original load line—information tied directly to the part’s remaining life.
Three views of the same broken surface
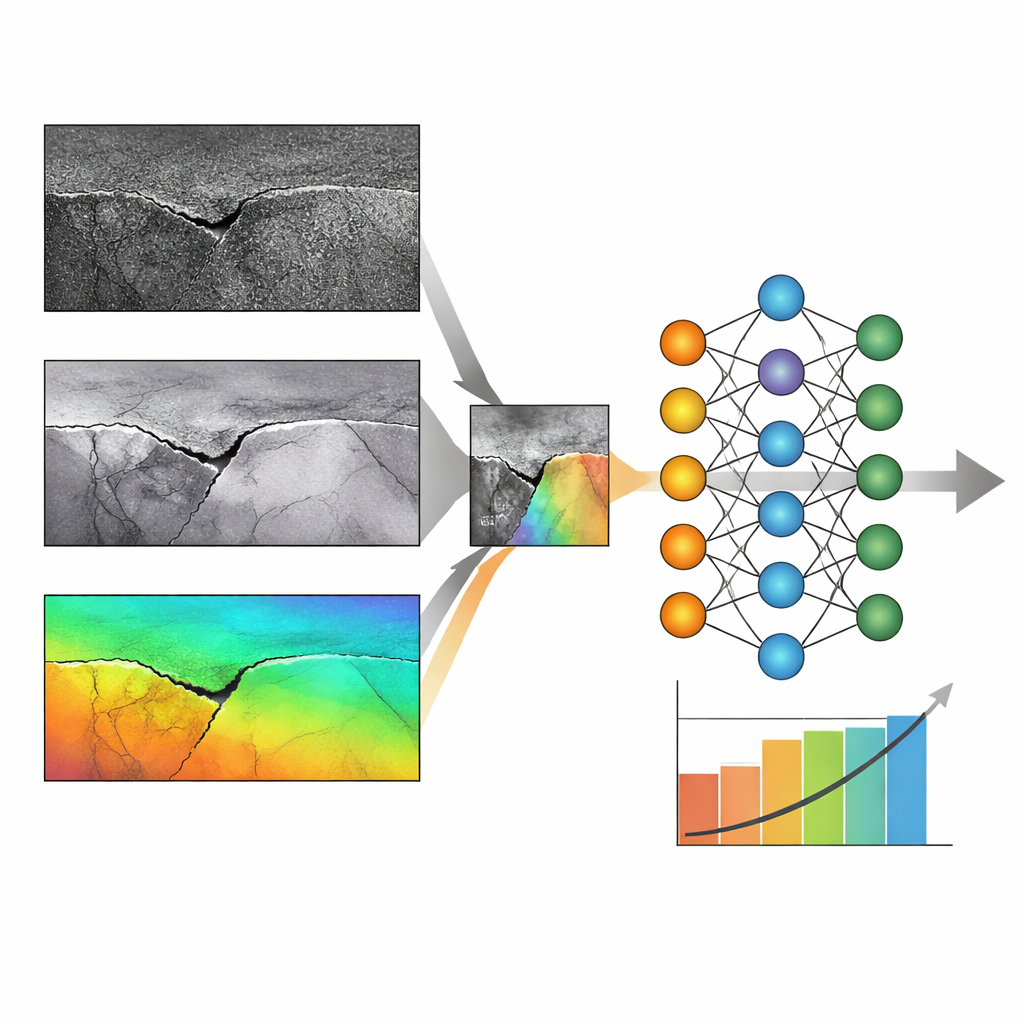
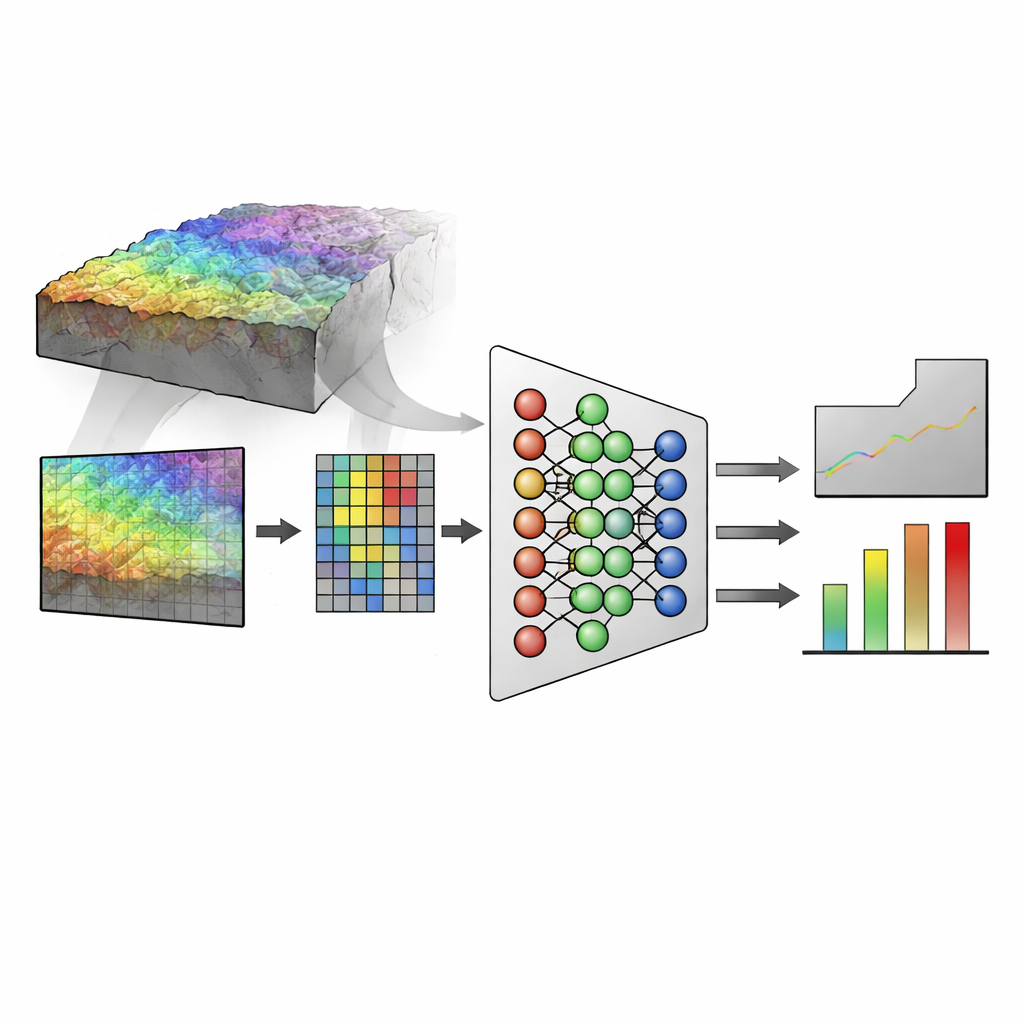
The study combines three distinct imaging methods that each reveal different aspects of the same fracture surface. First, secondary electron (SE) images from a scanning electron microscope capture fine topography—the small ridges and pits on the surface. Second, back-scattered electron (BSE) images emphasize differences in the underlying microstructure, highlighting how different phases of the alloy respond to cracking. Third, scanning white light interferometry (SWLI) provides an actual height map of the surface, giving precise three-dimensional information about roughness over larger areas. By carefully aligning these three kinds of images so that the same microscopic features line up, the authors pack them into the red, green, and blue color channels of a single composite image that can be fed into a standard image-recognition neural network.
Teaching a neural network to read fracture fingerprints
The team uses a convolutional neural network originally trained on everyday photographs and adapts it to recognize patterns in the composite fracture images. They crop large scans of the fracture surface into many small tiles, each representing a tiny patch of the crack path. For each tile, the network is trained to do two things: classify the forging direction of the specimen (a stand-in for how the metal was processed) and predict numerical values such as the distance along the crack and the crack growth rate. They first test each imaging method alone, then test all six possible ways of assigning SE, BSE, and SWLI to the three color channels, to see whether the ordering matters for performance.
What the combined images reveal
Individually, each technique contributes something important. SWLI, which measures true surface height, is best at predicting how far the crack has grown along the specimen. BSE images excel at identifying the forging direction, likely because they emphasize differences in the alloy’s phases that influence how cracks propagate. SE images fall between the two. When the three modalities are fused into one color image, the models become significantly more accurate and more reliable from one data split to another. The best combination cuts the error in predicting crack length by nearly half compared with earlier work that used only a single imaging method, and improves directional classification to essentially perfect accuracy on the available data. The network can also estimate crack growth rate over a realistic range, achieving about 10% error across that span, despite the relatively small dataset.
Why this approach could change failure analysis
Beyond better numbers, the study demonstrates a powerful idea: data from very different instruments can be merged into a form that off-the-shelf vision networks can digest, without designing new algorithms from scratch. Treating height maps and electron images as different “colors” in a single picture lets the neural network discover subtle links between surface roughness, microstructure, and loading history. For engineers, this points toward a future where the fractured surface of a failed part can be scanned once, and software quickly provides quantitative estimates of how the crack grew and under what conditions. Such tools could improve failure investigations, guide safer designs, and eventually help monitor components in service before they reach the breaking point.
Citation: Jones, K., Shade, P., John, R. et al. Combining multimodal fatigue fracture surface images for analysis with a CNN. Sci Rep 16, 9561 (2026). https://doi.org/10.1038/s41598-025-97184-z
Keywords: fatigue fracture, multimodal imaging, convolutional neural networks, materials failure analysis, titanium alloys