Clear Sky Science · en
A fully automated workflow for the digital image analysis of the intestinal microcolony survival assay
Why Faster, Fairer Tissue Reading Matters
When doctors and scientists study how radiation affects the gut, they often rely on painstaking inspection of microscope images. Experts must visually count tiny pockets of regenerating cells in the small intestine, a task that is slow, tiring, and surprisingly subjective. This paper presents a way to hand much of that work to a computer, using modern image analysis and artificial intelligence (AI) to count these structures automatically. The goal is simple but powerful: make radiation studies more consistent, faster, and less dependent on scarce expert time.
From Mouse Intestine to Digital Slides
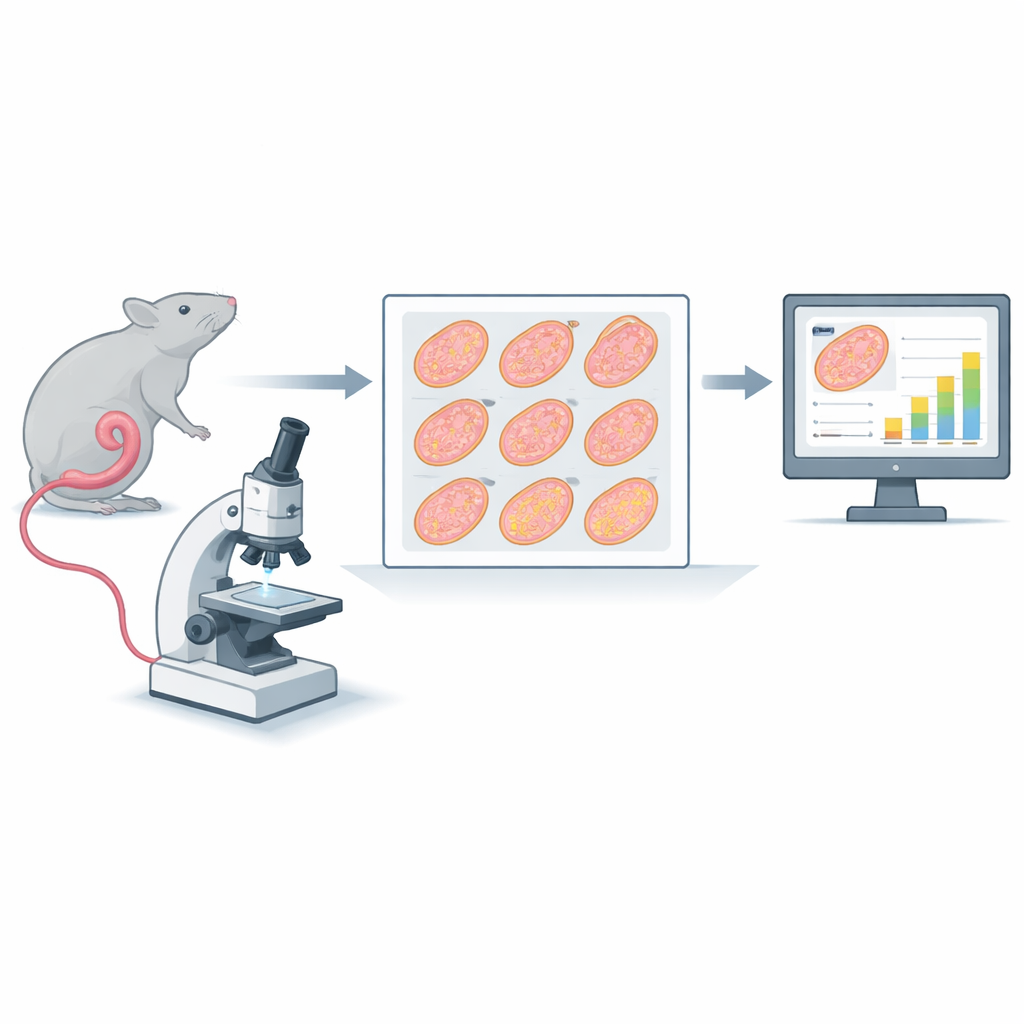
The research centers on a classic test called the intestinal microcolony survival assay. In this test, mice receive radiation to the abdomen. About three and a half days later, a portion of the small intestine (the jejunum) is removed, cut into nine short segments, embedded in wax, sliced into ultra-thin cross-sections, stained, and scanned at high resolution. Each scan produces a huge digital image containing nine circular profiles of gut tissue. Traditionally, trained observers zoom into each circle and count the crypts—small gland-like pockets along the inner edge where cells regenerate. Fewer surviving crypts indicate more severe damage from radiation or combined treatments such as chemotherapy.
The Problem with Hand Counting
Manual counting might sound straightforward, but the paper shows it is anything but. Fifteen people, including both seasoned and novice counters, were trained to follow standard rules for what qualifies as a crypt. Even so, their tallies on the same images often differed widely. Across more than 300 slices, the average difference from the group’s mean count was about one-third, and disagreement was worst when there were very few crypts. Even among three experts with years of experience, differences of around ten percent remained. Such variation can be as large as the treatment effects scientists are trying to measure, raising the risk that important findings are blurred by human noise.
How the Automated Workflow Operates
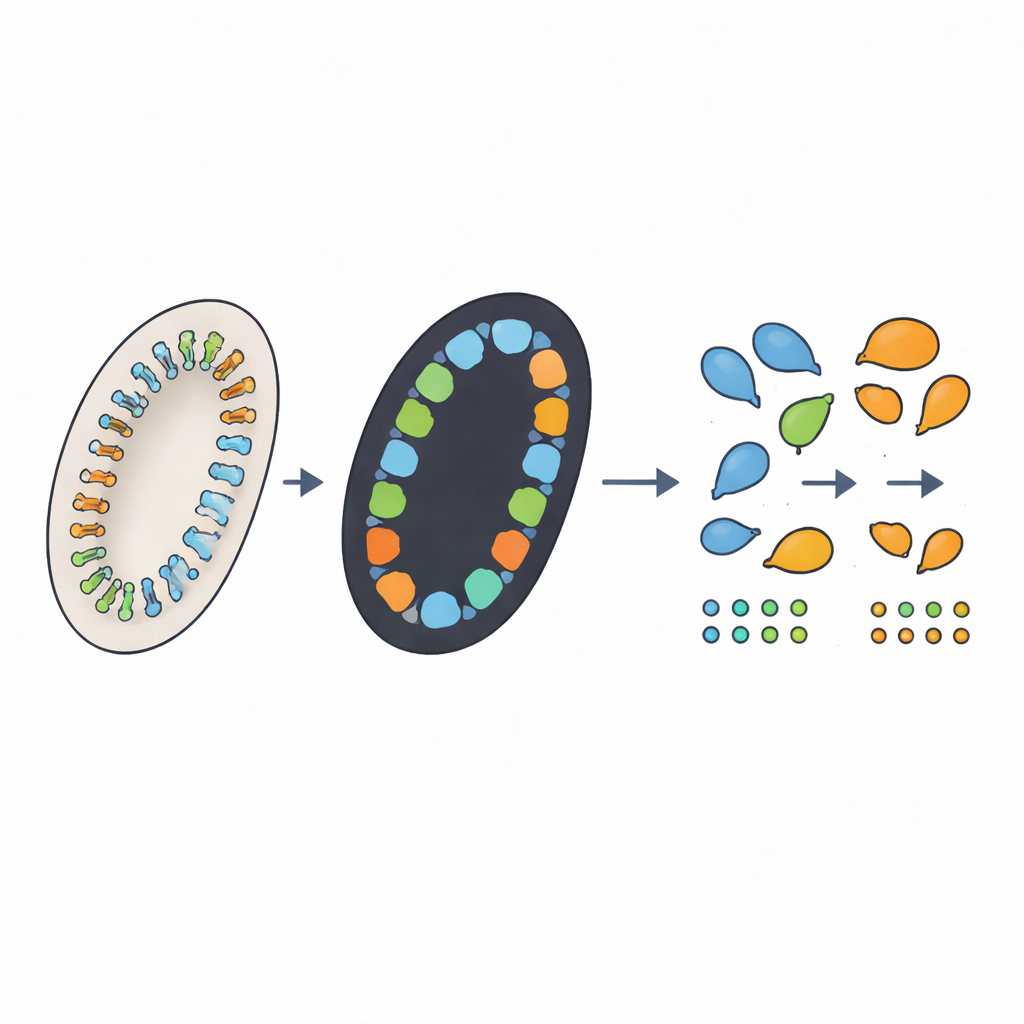
The authors designed a four-step automated workflow to mirror what a careful human would do, while adding extra capabilities. First, a computer script takes each large slide image and automatically crops out the nine tissue circles, adjusting for differences in image size and stain color. Second, a deep-learning model called nnU-Net marks which pixels belong to crypts in each circle, producing a black-and-white “mask” of likely crypt regions. Third, a custom algorithm traces the edges of each region, filters out tiny specks that are too small to be real crypts, and—crucially—tries to split any fused regions that actually contain multiple neighboring crypts. Finally, a graphical interface lets a human reviewer see the outlines overlaid on the original images, correct mistakes with a few clicks, and save final counts and measurements automatically.
Matching Human Experts, but in Hours Not Weeks
To see how well the automated workflow performed, the team compared its counts against expert assessments on several datasets. For images used to train the system, the deep-learning step marked crypt regions with very high accuracy, and the counting algorithm came within a few crypts of the expert consensus, especially after the fused-crypt splitting step was added. On new images not seen during training, the automated counts differed from the three experts’ average by about ten percent—similar to, or slightly better than, the differences among the experts themselves. When experts later reviewed and corrected the automated results via the interface, they typically needed under a minute per image. Overall, a full experiment involving 60 mice could be processed in only a few hours of computer time and a handful of minutes of human effort.
New Ways to Describe Gut Damage
Because the workflow analyzes full digital images, it can easily measure features that are hard to track by hand, such as the length of the intestinal circumference or the area of each crypt. The authors explored whether adjusting crypt counts for these features—essentially asking whether “crypts per unit of gut length” or “crypts adjusted for their size” better reflect radiation damage—would provide a cleaner signal. In this particular study, none of the alternative measures consistently outperformed raw crypt counts, but the approach demonstrates how automated image analysis can open the door to richer, more nuanced markers of tissue injury.
What This Means for Future Research
For non-specialists, the key takeaway is that the researchers have built a practical digital helper that can read complex tissue slides almost as reliably as seasoned experts, but far more quickly and consistently. By reducing tedious manual work and smoothing out human differences, this automated system can make gut radiation studies more robust and easier to compare across laboratories. The authors also highlight clear paths for further improvement, such as using models that directly separate neighboring crypts. Beyond this single assay, their framework offers a template for automating other microscopic evaluations, moving pathology toward a future where careful human judgment is supported—rather than replaced—by transparent, trustworthy AI tools.
Citation: Baikalov, A., Wang, E., Neill, D. et al. A fully automated workflow for the digital image analysis of the intestinal microcolony survival assay. Sci Rep 16, 9633 (2026). https://doi.org/10.1038/s41598-025-34719-4
Keywords: intestinal microcolony survival assay, automated histopathology, deep learning image analysis, radiation-induced gut injury, crypt counting workflow