Clear Sky Science · en
Assessing the effectiveness of the ZICOMP-Shewhart control chart for monitoring zero-inflated processes
Why many zeros still matter
Modern factories, hospitals, and computer systems often do their jobs so well that problems are rare. Quality logs may show long stretches of perfect units—zero defects—interrupted by the occasional burst of trouble. At first glance this looks like good news, but it actually makes it harder to tell when a process is quietly drifting out of control. This paper tackles that challenge by developing and testing a specialized statistical tool—the ZICOMP‑Shewhart control chart—built to monitor processes where “nothing happens” most of the time, but not all of the time.
Watching quality over time
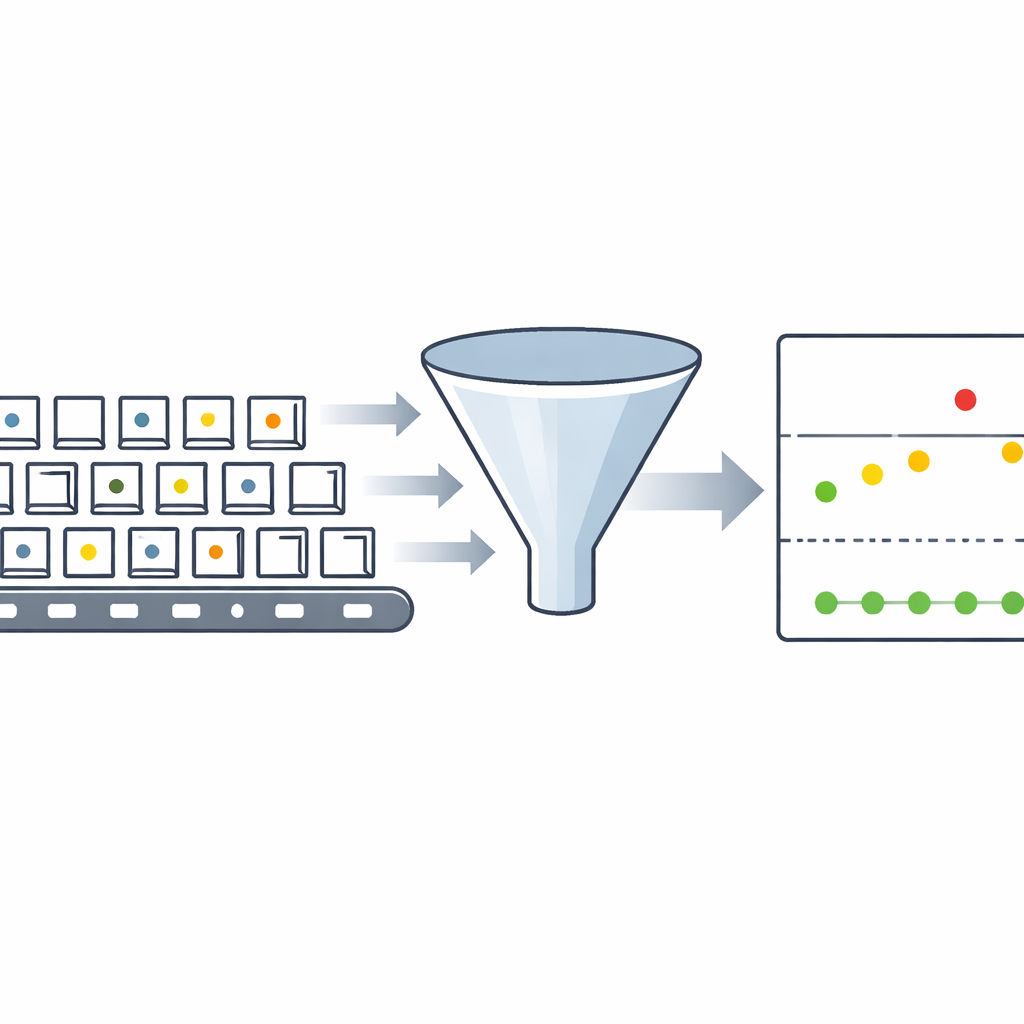
In quality control, engineers use control charts to track how a process behaves over time. Each new batch, item, or time period is summarized as a point on the chart. As long as points stay within expected limits, the process is considered stable; when they cross a limit, an alarm is raised and the process is investigated. Traditional charts work well when the number of defects follows simple patterns, such as the familiar Poisson distribution. However, in many modern “high‑yield” processes—like hard‑disk manufacturing or error monitoring in data centers—most observations are exactly zero, with just a few nonzero counts. Standard models underestimate this excess of zeros and often misjudge the amount of variation, which can delay or mask important warnings.
Giving zeros their own model
The authors build on a flexible family of models called the Conway–Maxwell–Poisson (COMP) distribution, which can handle data that are more variable or less variable than the classic Poisson case. They extend it to the zero‑inflated COMP (ZICOMP) distribution, which explicitly separates two ingredients: the chance that a result will be zero at all, and the pattern of nonzero counts when problems do appear. This allows the model to adapt to three common situations: highly variable data with long right tails, roughly balanced data, and tightly clustered data with little spread. The ZICOMP‑Shewhart control chart uses this richer description to set a single upper limit that is tuned to processes where zeros are especially common.
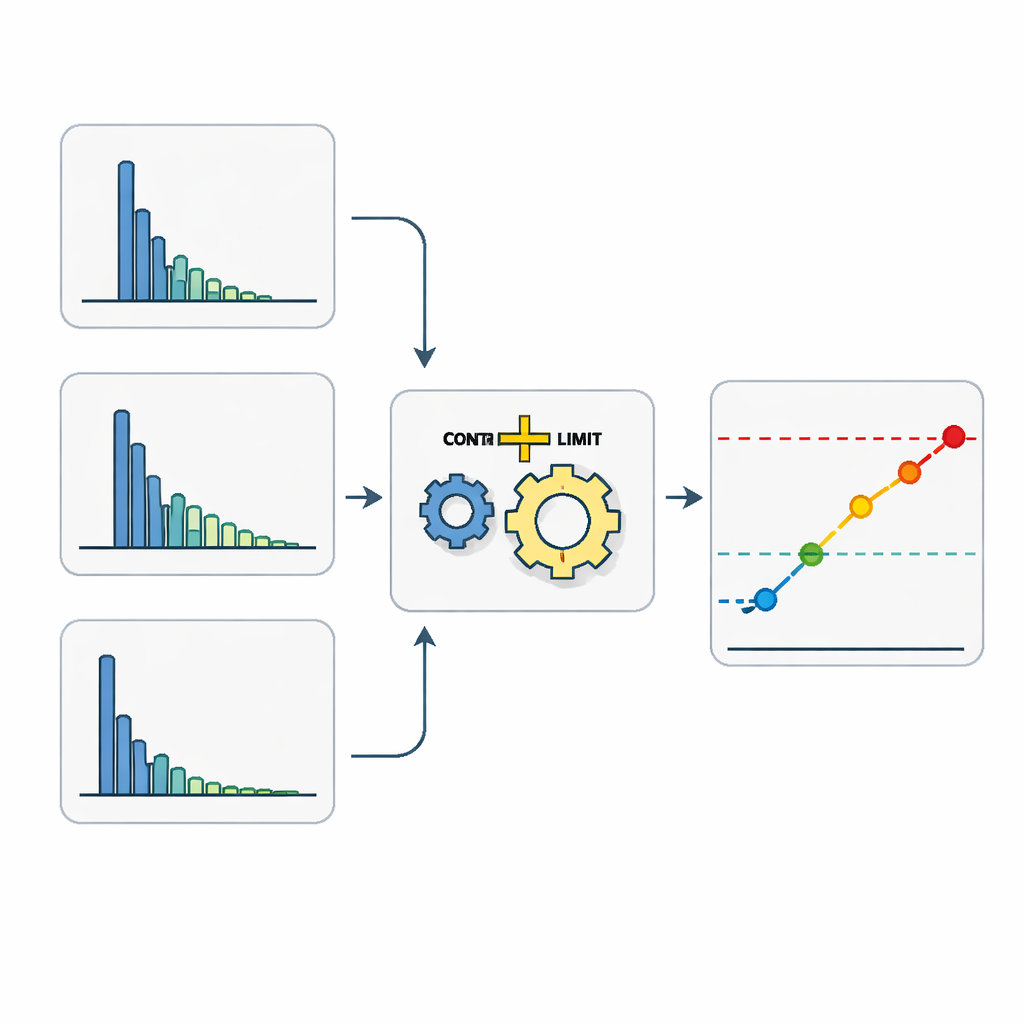
Designing smarter alarm limits
A central question in practice is how high to place the alarm line. If it is too low, the chart cries wolf; if it is too high, real problems are missed. The authors use large‑scale computer experiments to explore how a “limit coefficient” controls this trade‑off. They study two key performance measures. One is the average run length, which is the expected number of samples before the chart signals; this reflects how often false alarms occur when the process is healthy. The other is the Type II error, the chance that the chart fails to signal when the process has really shifted. By sweeping across many combinations of model parameters—for different levels of variability and different amounts of zero inflation—they show how to choose the limit coefficient to get a desired average run length while keeping missed alarms acceptably low, even when the discrete nature of the data makes perfect tuning impossible.
Putting the method to the test
To see how their chart behaves in realistic settings, the authors compare it against a competing design that assumes no special treatment for zeros and only uses the COMP distribution. Through multiple simulated scenarios, they repeatedly find that the ZICOMP‑Shewhart chart spots shifts in the defect rate earlier and more often, whether the data are highly variable, moderately variable, or tightly clustered. In a case study using real hard‑disk read‑write error data—where long stretches of error‑free operation are punctuated by bursts of failures—the new chart successfully detects a change after a run of zeros followed by larger counts, showing how it can serve as an early‑warning system in high‑reliability environments.
What this means in practice
For practitioners, the message is that ignoring the special role of zeros can hide important signals about process health. By building a control chart around a model that recognizes both extra zeros and unusual patterns of variation, the ZICOMP‑Shewhart chart gives a more reliable picture of when a process is truly drifting away from its intended behavior. Although its performance still depends on how well the underlying parameters are estimated, and future work may refine these estimates further, this study demonstrates that tailoring statistical tools to the quirks of real data can make quality monitoring more sensitive, more trustworthy, and ultimately better at preventing costly failures.
Citation: Sattar, A., Raza, M.A., AL-Essa, L.A. et al. Assessing the effectiveness of the ZICOMP-Shewhart control chart for monitoring zero-inflated processes. Sci Rep 16, 8269 (2026). https://doi.org/10.1038/s41598-025-32581-y
Keywords: zero-inflated count data, statistical process control, quality control charts, Conway-Maxwell-Poisson, manufacturing defects