Clear Sky Science · en
A high-resolution spatiotemporal wildfire propagation dataset for the Mediterranean and Europe
Why tracking fires day by day matters
Wildfires are no longer rare disasters we watch from afar. Hotter, drier weather is making large, long‑lasting fires more common across Europe and the Mediterranean, threatening homes, health, nature, and critical infrastructure. To understand and manage these fires, scientists need to know not just where a fire ended, but how it moved from day to day across the landscape. This paper introduces a new open dataset that captures wildfire spread at high detail in both space and time, giving researchers a powerful lens on how modern fires behave.
A new map series of moving fire fronts
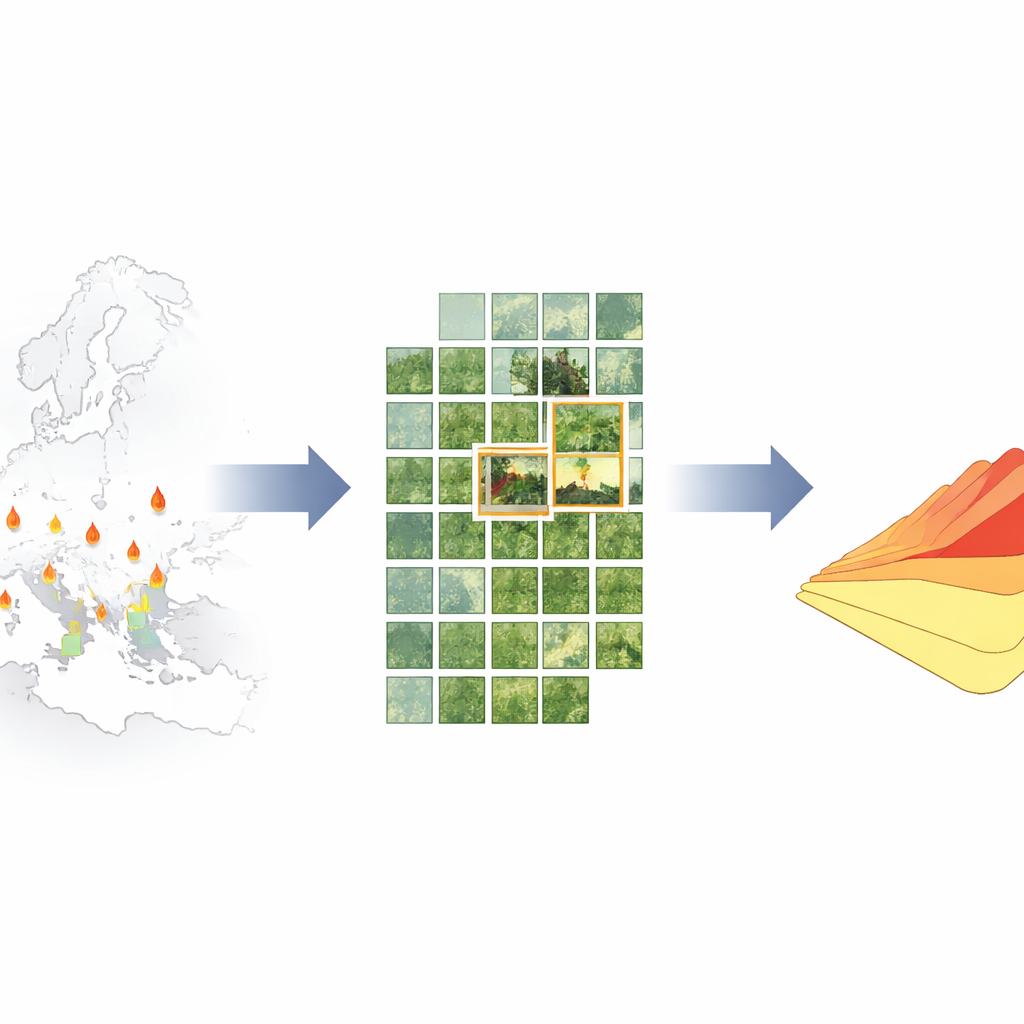
The authors present FireSpread_MedEU, a collection of detailed maps that show how 103 individual wildfires grew across Europe and the Mediterranean between 2017 and 2023. Instead of offering only a single outline of each fire’s final scar, the dataset records up to daily snapshots of the burned area as it expanded, for a total of 320 distinct growth steps. Each map traces the outer edge of the burned zone at a given point in the fire’s life, much like a time‑lapse drawing of the advancing fire front. This level of detail opens the door to examining how quickly fires spread, how they respond to weather, and how they interact with different types of vegetation.
Looking from space with fine detail
To build these maps, the team turned to high‑resolution commercial satellites operated by Planet Labs. These small spacecraft take optical images of the Earth’s surface at roughly three‑meter resolution, often once per day. That is sharp enough to see the structure of individual burned patches and how they grow from one day to the next. The researchers first used a semi‑automatic method to pick out burned ground in each image, relying on how fire‑darkened land reflects near‑infrared light differently from unburned vegetation. They then cleaned up these preliminary outlines by hand, correcting errors caused by smoke, clouds, or confusing land features such as dark water or bare soil.
Turning raw images into usable fire shapes
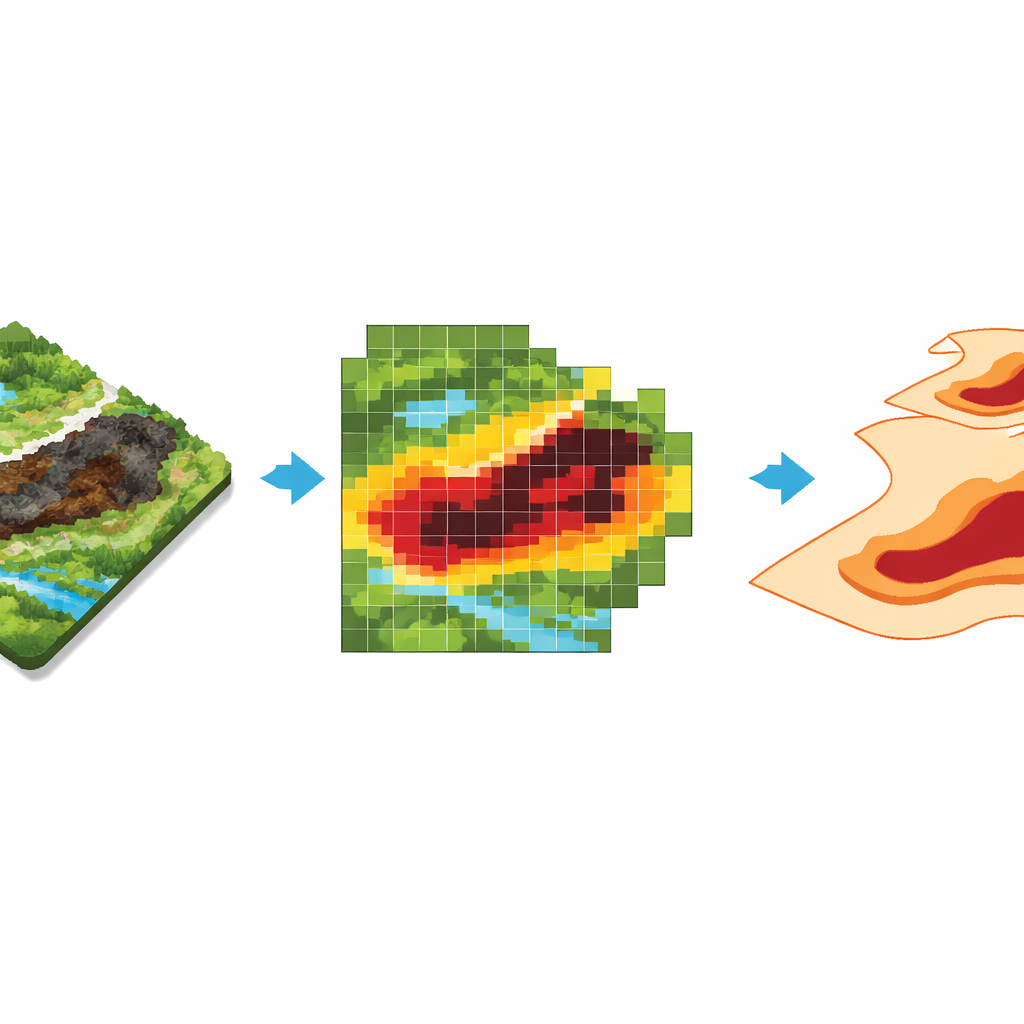
Under the hood, each burned area map starts as a grid of pixels whose brightness has been adjusted to remove extreme values and make images comparable. The researchers set a tailored cutoff in the near‑infrared channel so that pixels darker than this threshold likely belong to burned terrain. Clusters of such pixels were then grouped into larger shapes, while obvious false detections—like water bodies—were removed. Because it is difficult to distinguish small unburned islands inside the fire from truly missed burned patches using only a few color bands, the team focused on mapping the outer boundary of each scar. Finally, they converted the pixel clusters into smooth polygons that can be easily handled in mapping software.
Adding context about the land and the data
Wildfire spread depends strongly on what is burning, so every mapped fire step is linked to a land‑cover map that classifies the ground beneath it—such as forests, shrubs, crops, grasslands, or urban areas. For each burned shape, the dataset lists the fraction of its area that falls into each of these broad categories. The authors also include a rich set of descriptive fields: when and at what time the satellite image was taken, how large the burned area was, and how clearly it could be seen, with a four‑level quality rating based on the amount of smoke and cloud cover. Even dates when no outline could be drawn, for example due to dense smoke or missing images, are kept in the record along with the reason.
How researchers and planners can use it
Because FireSpread_MedEU is shared as a single, well‑documented map file, it can readily feed into wildfire models, risk studies, and new computer‑vision tools. Scientists can test how well their fire spread simulations reproduce the observed day‑by‑day growth of real fires, or check whether automated burned‑area products from other satellites get the size and shape of fires right. The data also highlight their own limits: gaps of several days occur when smoke or clouds blocked the view, and the interior texture of burns is simplified to their outer edge. Still, by combining fine spatial detail with frequent snapshots in time, this dataset gives the research community a valuable new foundation for understanding and anticipating the behavior of wildfires in a warming Europe.
Citation: Müller, S., Hofmann-Böllinghaus, A., Chen, Z. et al. A high-resolution spatiotemporal wildfire propagation dataset for the Mediterranean and Europe. Sci Data 13, 389 (2026). https://doi.org/10.1038/s41597-026-06965-2
Keywords: wildfires, satellite data, climate change, fire spread, remote sensing