Clear Sky Science · en
Global 0.05° Grid-Based Dataset of Keyhole Imagery with Spatio-Temporal Indicators (1960–1984)
Why old spy photos still matter today
Long before Google Earth and everyday satellite maps, Cold War spy satellites quietly photographed nearly every corner of the globe. Those missions, known as the Keyhole program, were built for military intelligence, not science. Yet their declassified images, taken from the 1960s to the early 1980s, now offer some of the sharpest historical views we have of Earth’s surface. This paper turns that scattered archive into an organized, easy-to-use global dataset so that researchers—and eventually society at large—can better trace how our landscapes, cities, and ecosystems have changed over the last half century.
From secret missions to shared treasure
The United States launched a series of Keyhole satellites beginning in the early 1960s. These spacecraft captured film photographs with detail fine enough to pick out buildings, roads, and even small field patterns, long before civilian programs like Landsat began. For decades, the images were classified. Since the 1990s, however, large parts of the archive have been gradually released. Scientists have already used individual images to study forest loss, river migration, melting glaciers, coastal erosion, ancient irrigation systems, and the spread of cities and farmland. But the pictures were still difficult to work with at global scale because their locations, dates, and image quality were uneven and poorly described.
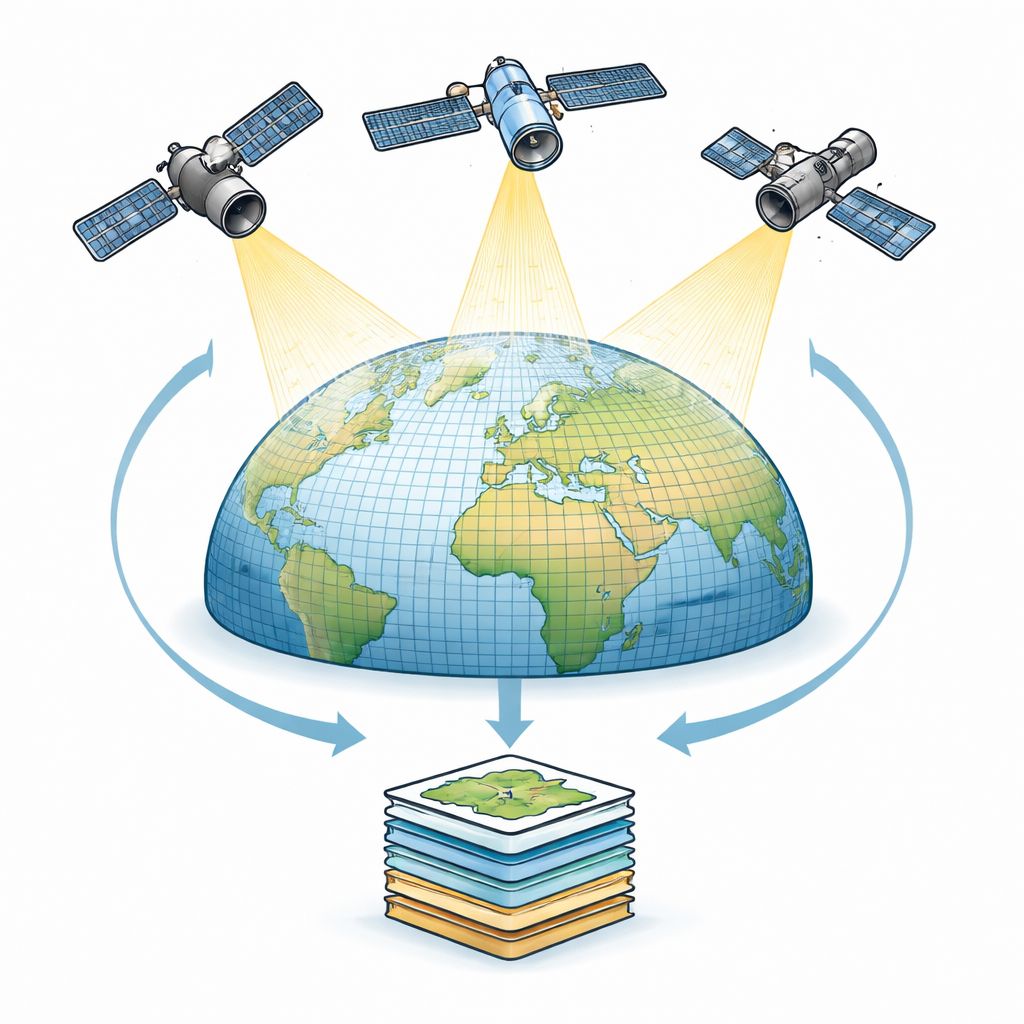
Putting the planet on a regular grid
To solve this, the authors built a new dataset called KRIST (Keyhole Reconnaissance Imagery Spatio-Temporal coverage). They started by downloading footprint outlines and basic information for more than 1.4 million Keyhole scenes from the U.S. Geological Survey. These scenes come from several satellite families, each with different sharpness, area coverage, and mission periods. The team cleaned and standardized this information, grouping images into three simple resolution bands: very fine (about one meter), medium (around three meters), and coarser (about ten meters). Then they overlaid all of these image footprints onto a global grid of regularly spaced points, about 5.6 kilometers apart, designed so that each cell represents the same area anywhere on Earth.
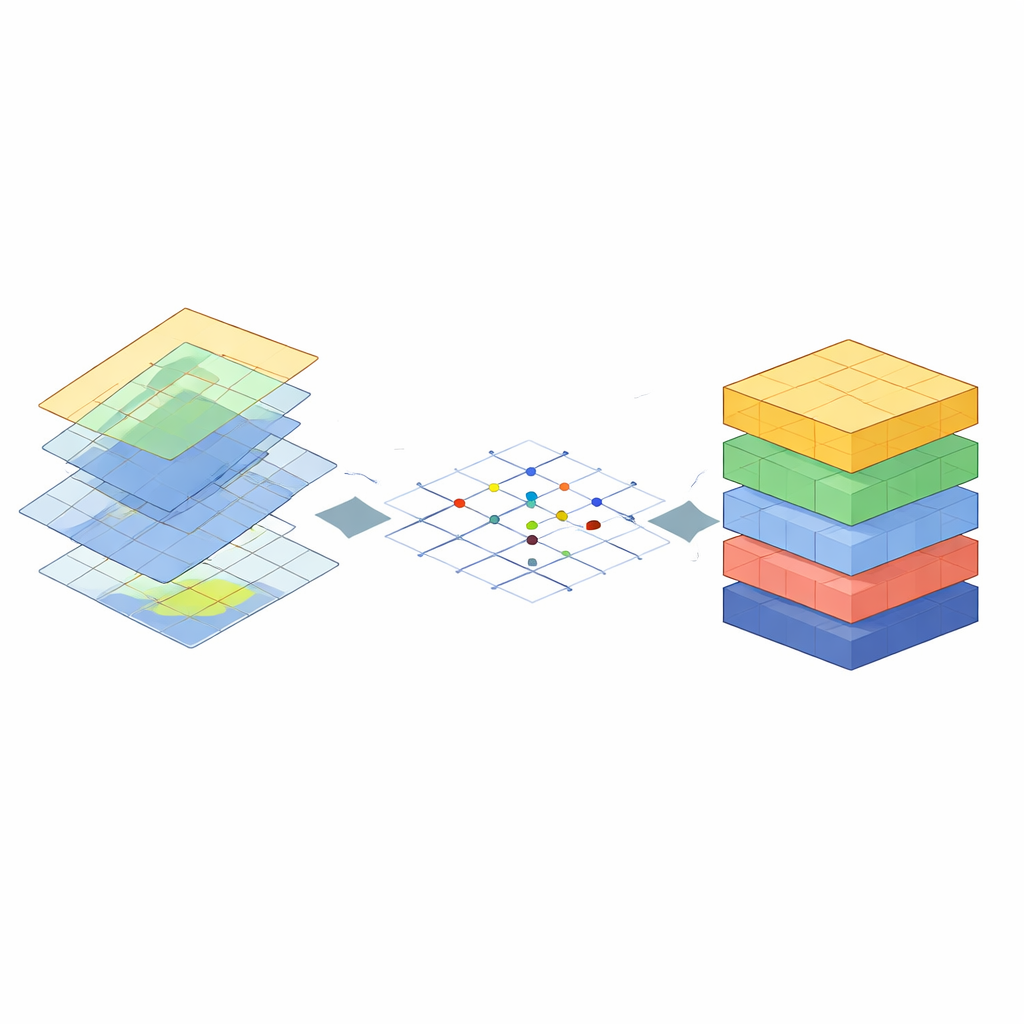
Turning scattered images into clear indicators
At every grid point that fell inside at least one image, the researchers calculated a set of indicators that describe what kind of historical view is available there. These include how many times a place was photographed, on how many distinct dates, when the first and last images were taken, and how many years lie between those endpoints. They also identified the year—and three-year window—with the densest imaging, and recorded which of five broad time slices (1960–1964, 1965–1969, and so on up to 1984) have coverage. Finally, they labeled each point according to the mix of resolution levels it received, from only coarse images to rich combinations of fine, medium, and coarse scenes. All of this information is stored in open, common formats, alongside links back to the original image records for quick inspection.
What the global patterns reveal
The resulting picture shows that Keyhole coverage is both extensive and highly uneven. Many locations have only a handful of usable images, often clustered within a few years, while a smaller set of regions—such as parts of Europe, Russia, China, India, and North America—were photographed repeatedly over a decade or more. Two main waves of imaging stand out: one in the mid-1960s and another in the early to mid-1970s, mirroring major phases of satellite deployment. More than half of all grid points have images from at least two different time periods, making them suitable for before-and-after comparisons, but very few places were observed consistently across the entire 25-year span. Likewise, some areas enjoy overlapping fine and coarse views, ideal for checking details against broader context, while others are represented by only one resolution level.
Why this matters for studying change
By organizing decades-old spy imagery into a clear, map-based index, this work turns a once opaque archive into a practical tool for tracking long-term change. Researchers can now quickly see where and when sharp historical images exist, decide whether a region has enough observations for their questions, and plan if they need to buy additional, still-paywalled scenes. Although the dataset cannot fill every gap—clouds, short observing runs, and uneven coverage remain—it bridges a crucial period before modern Earth-observing satellites became routine. In doing so, KRIST helps scientists piece together a more continuous story of how human activity and natural forces have reshaped the planet since the mid‑20th century.
Citation: Wang, T., Zhang, X., Shan, M. et al. Global 0.05° Grid-Based Dataset of Keyhole Imagery with Spatio-Temporal Indicators (1960–1984). Sci Data 13, 463 (2026). https://doi.org/10.1038/s41597-026-06866-4
Keywords: Keyhole satellite imagery, historical Earth observation, land use change, global remote sensing dataset, Cold War spy satellites