Clear Sky Science · en
A longitudinal dataset of physiological, hormonal, metabolic, and self-reported menstrual health data
Why Your Period Is a Window Into Whole-Body Health
The rhythms of the menstrual cycle touch far more than the uterus. They influence sleep, mood, metabolism, and even heart function. Yet most of what science knows about everyday menstrual health comes from small studies in labs or from phone apps that do not measure hormones directly. This paper introduces a new public dataset, called mcPHASES, that brings together wearable sensor data, hormone tests, and daily symptom reports from dozens of young adults over many months. It offers a rare, detailed look at how changes in hormones ripple through the rest of the body during real life, not just in the clinic. 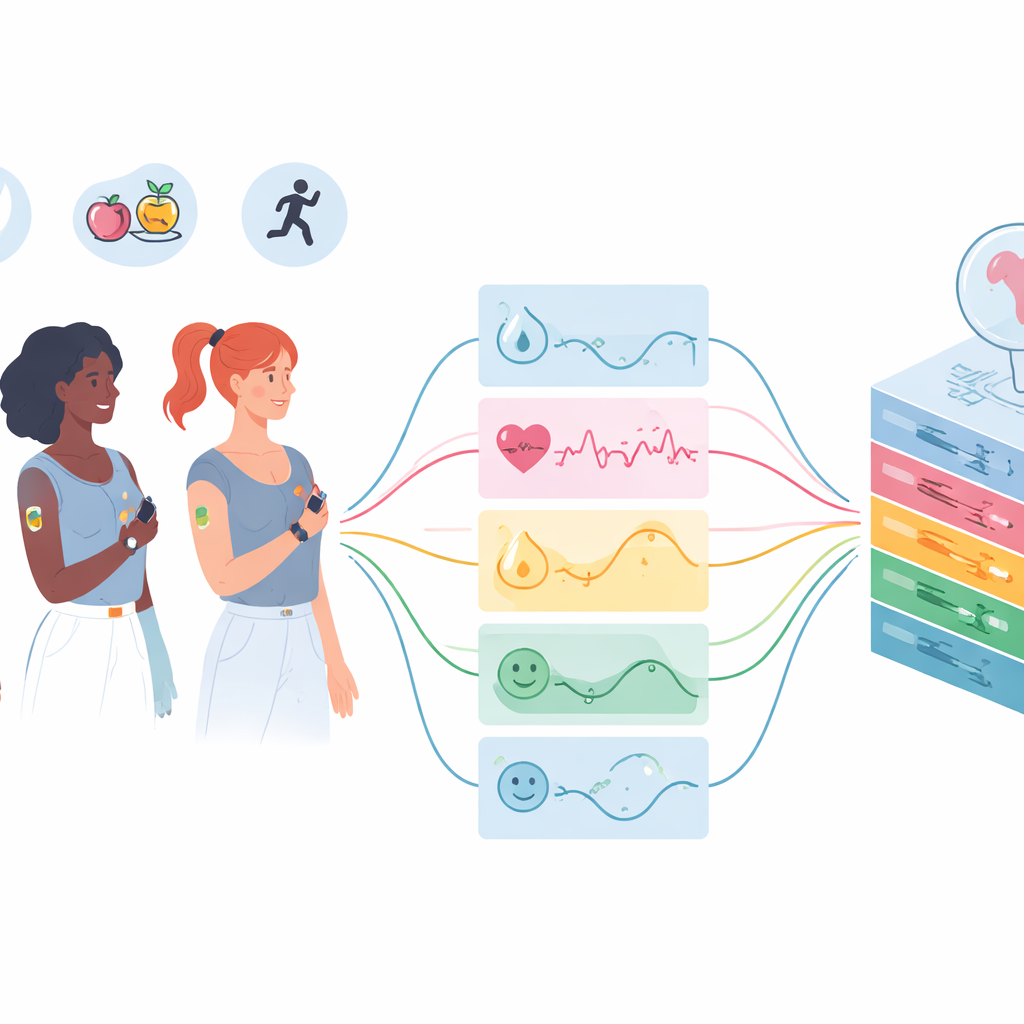
Following Everyday Life Across Many Cycles
The researchers invited 50 menstruating adults in the Toronto area to join a three‑month study in 2022, with 20 of them returning for another three months in 2024. Forty‑two participants ultimately agreed to share their de‑identified data publicly. During the first interval, participants wore a Fitbit Sense smartwatch and a continuous glucose monitor around the clock, used an at‑home urine hormone test every morning, and filled out a short daily diary about their period, pain, stress, sleep, and activity. In the second interval, to reduce burden, the team focused on the smartwatch and hormone tests and made the diary optional. This design captures both short‑term ups and downs within a single cycle and longer‑term shifts as people’s lives change over years.
Many Streams of Body Signals in One Place
The resulting mcPHASES dataset contains 23 linked tables. One holds basic background details such as age and gender identity. Another collects daily self‑reports of symptoms and menstruation timing, along with hormone values typed in from the home test device. The rest store high‑frequency signals from the wearables: heart rate, heart rate variability, sleep timing and quality, steps, activity intensity, wrist skin temperature, breathing patterns during sleep, estimated blood oxygen, stress scores, and more. Continuous glucose data provide minute‑by‑minute information about blood sugar levels. Each entry is tied to an anonymous participant ID and a “day in study” counter instead of calendar dates, protecting privacy while still allowing researchers to study trends over time.
Turning Raw Signals Into Cycle Phases
To make sense of these overlapping streams, the authors used the hormone device’s own estimates of fertile days and menstruation onset to label four broad phases for each cycle: menstruation, late‑follicular, ovulation, and luteal. They intentionally avoided heavy cleaning or gap‑filling, leaving missing data in place so other scientists can test their own methods. Internal device software may have changed between 2022 and 2024, but the core measures remain comparable. By aligning days as a percentage of each person’s cycle length, the team could average hormone levels and sensor signals across many cycles, revealing how the “typical” pattern unfolds even as individuals vary. 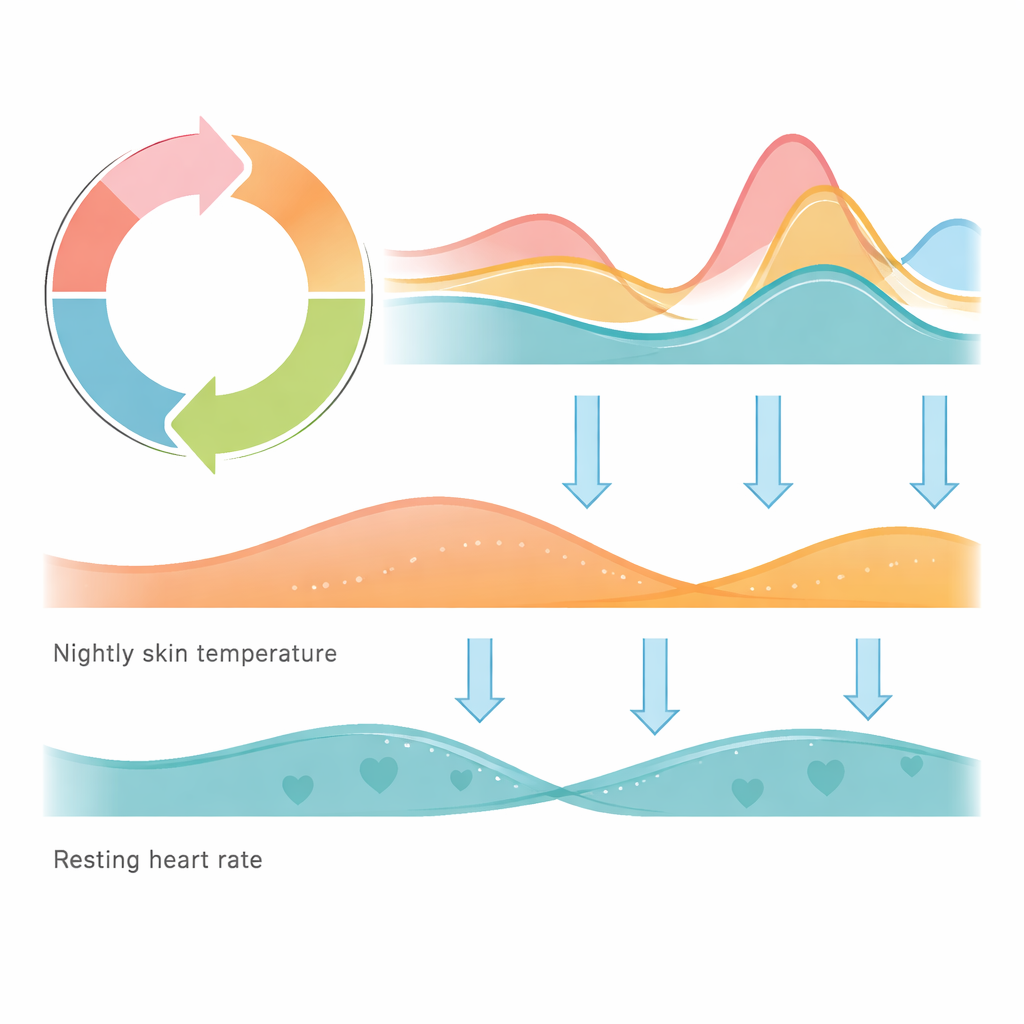
What the Body’s Patterns Reveal
When the authors plotted hormone levels across a normalized cycle, the shapes matched textbook patterns: a sharp mid‑cycle surge in luteinizing hormone, a gradual rise and mid‑cycle peak in estrogen, and a later rise in progesterone during the luteal phase. They then turned to two simple smartwatch measures: nightly wrist skin temperature and resting heart rate. Both followed clear, repeating patterns across the four phases in more than 190 complete cycles. Temperature and resting heart rate were lowest early in the cycle, climbed through the fertile window, and peaked in the luteal phase before dropping again with menstruation. These trends held across both study intervals, echoing past work that links progesterone to higher body temperature and to changes in the nervous system that speed the heart.
How This Resource Can Change Menstrual Health Research
To a non‑specialist, the key message is that the menstrual cycle is not just about monthly bleeding; it is a whole‑body rhythm that can be traced in subtle changes in temperature, heart rate, and other everyday signals. The mcPHASES dataset gives researchers an open, richly detailed map of these connections, combining hormones, wearables, and lived experience over time. Because the data are public and relatively unprocessed, they can be used to build better period and fertility predictions, to explore why some people’s cycles are irregular or more painful, and to treat menstrual patterns as an early sign of broader health issues. In short, this work lays the groundwork for seeing menstrual health as a vital sign that can be monitored with the same care as blood pressure or body weight.
Citation: Lin, G., Li, J.Y., Kalani, K. et al. A longitudinal dataset of physiological, hormonal, metabolic, and self-reported menstrual health data. Sci Data 13, 411 (2026). https://doi.org/10.1038/s41597-026-06805-3
Keywords: menstrual cycle, wearable sensors, hormone tracking, longitudinal dataset, menstrual health informatics