Clear Sky Science · en
A 32-year species-specific live fuel moisture content dataset for southern California chaparral
Why Moisture in Shrubs Matters for Fire
Wildfires in southern California chaparral can turn on a dime: one hillside burns fiercely while a nearby slope hardly catches. A big part of this difference lies inside the plants themselves, in how much water they are holding at any given moment. This paper presents a new, 32-year record of how wet or dry key shrub species have been across coastal southern California, giving fire managers, scientists, and communities a clearer picture of how fire danger builds and fades through the seasons and across the landscape.
Water Inside Plants as Hidden Fuel
The study focuses on “live fuel moisture content,” essentially the ratio of water to dry material in living plants, expressed as a percentage. High values mean leaves and stems are juicy and hard to ignite; low values mean they burn more like dry kindling. In chaparral, this moisture can swing from well above 300% to near the threshold where live fuels behave like dead ones. These swings depend on weather, soil moisture, plant traits, and sunlight. Because live fuel moisture strongly controls how quickly flames spread and how hot they burn, it has long been built into fire danger rating systems and fire behavior models. Yet, until now, detailed records have been scattered in space and time, usually limited to a few sites or short time spans.
Bringing Together Field Measurements and Eyes in the Sky
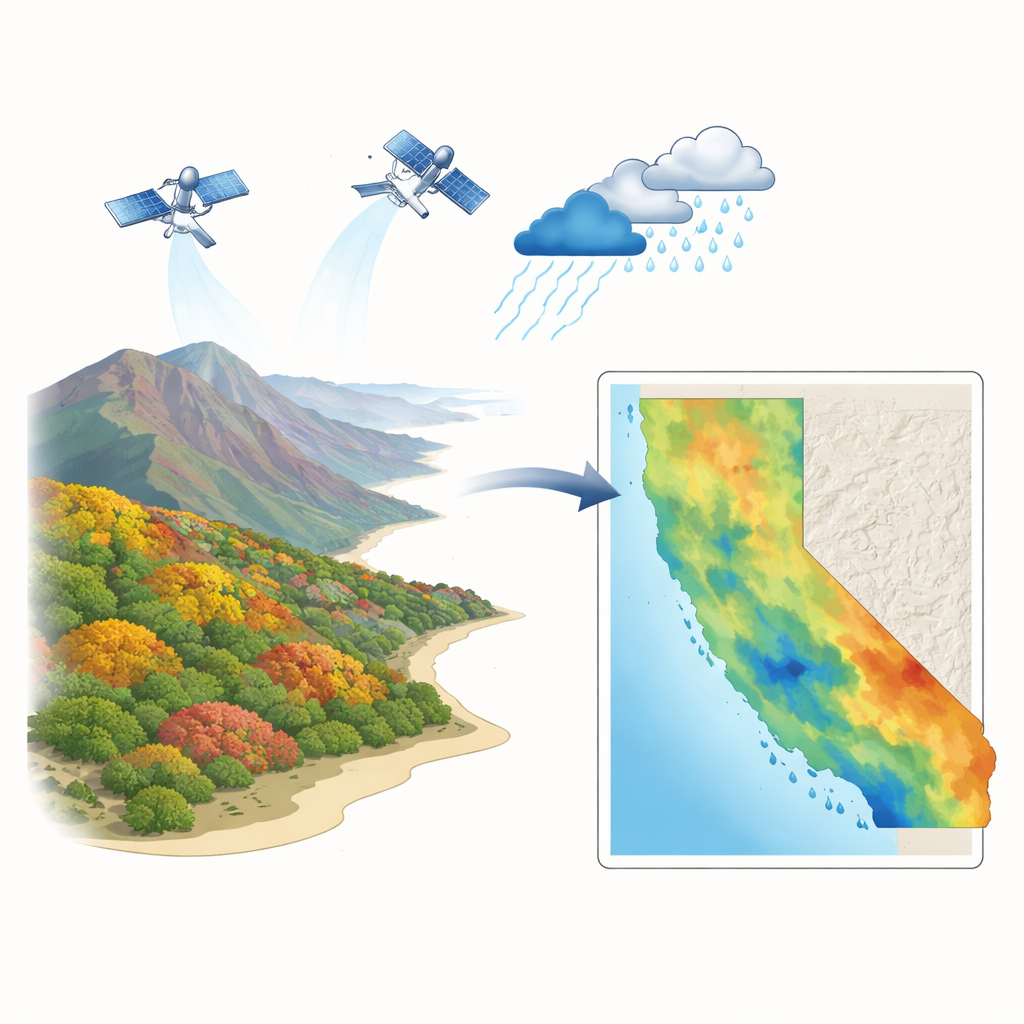
To build a long, detailed picture, the authors combined more than 10,000 shrub moisture measurements collected by fire agencies with two powerful sources of environmental information. First, they used a high-resolution weather model that reconstructs daily conditions such as temperature, rainfall, humidity, sunlight, wind, and soil moisture over 32 years for a 1-kilometer grid from San Luis Obispo County to the edge of Los Angeles County. Second, they tapped decades of NASA Landsat satellite imagery, distilling it into a vegetation index (NIRv) that emphasizes how much healthy green cover is actually present within each pixel, even in landscapes that mix shrubs, bare soil, and development. Together, these weather and satellite “predictors” track both the forces that dry or moisten plants and the plants’ visible response.
Teaching a Machine to Follow Seasonal Ups and Downs
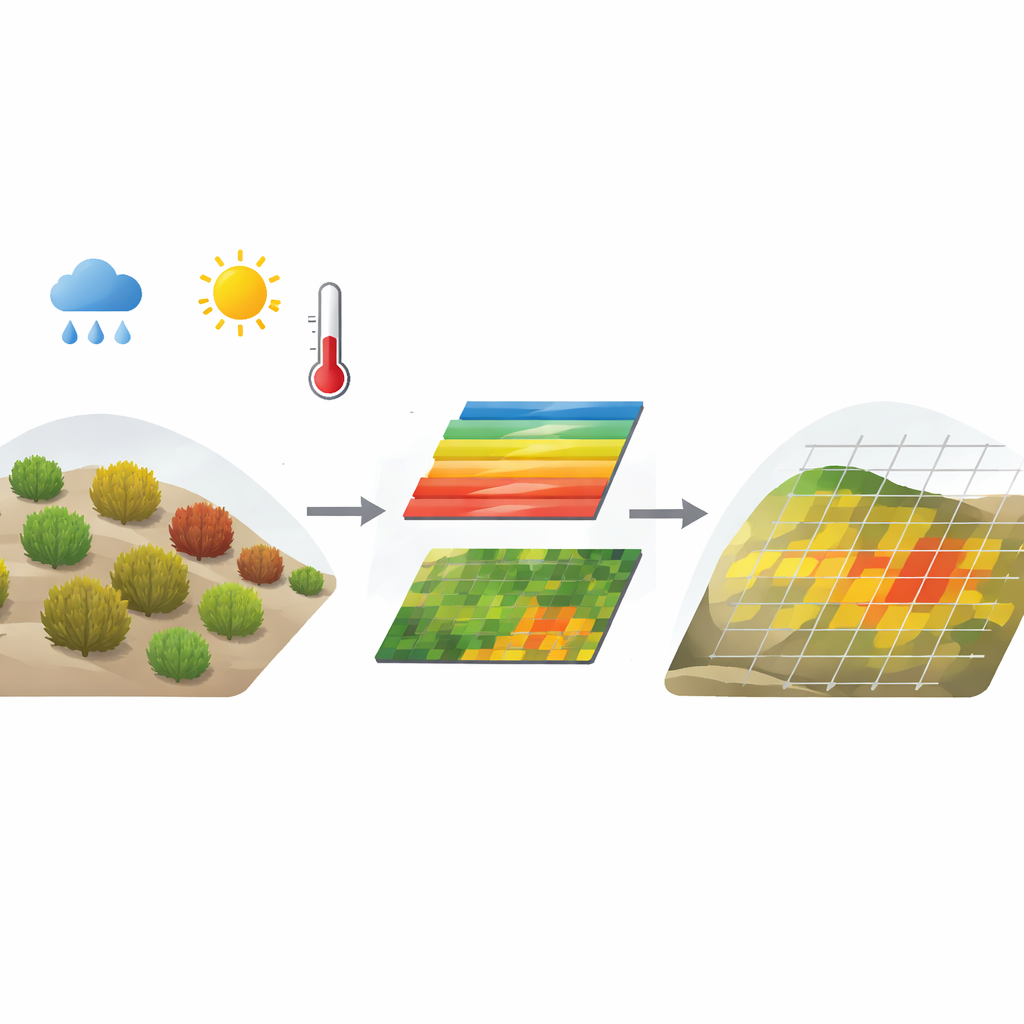
The team then trained separate machine-learning models, known as random forests, for four important chaparral fuel types: new growth chamise, old growth chamise, black sage, and bigpod ceanothus. These models learn patterns linking past and present weather, sunlight, and vegetation signals to the field measurements of moisture. They used both standard cross-validation and site-by-site testing, where whole sampling locations were withheld from training, to see how well the models could generalize. Once tuned, the models were run over the full 32-year period, producing semi-monthly moisture estimates at 1-kilometer resolution for every grid cell in the domain. Because cloud cover sometimes blocks the satellite view, the authors carefully filled small gaps using spatial interpolation to keep the record continuous in space and time.
Sharpening the Picture for a Key Species
Chamise, the dominant and highly flammable shrub in much of California chaparral, had by far the most measurements, so the authors went a step further to reduce systematic errors. They noticed that the model tended to overshoot during the wettest times and undershoot during the driest times at some sites. To correct this, they applied a method called quantile mapping: comparing the distribution of predicted and observed values at each site, computing how much the model typically needed to be nudged at different moisture levels, and then spreading those corrections across the full map using elevation and location. The resulting bias-corrected chamise dataset achieved a mean absolute error under 10 percentage points and captured key thresholds associated with large fire growth. Uncertainty estimates, based on how much individual decision trees in the model disagree, were also included so users can see where predictions are less certain.
What This Means for Living With Fire
The finished dataset offers a detailed, 32-year view of how live fuel moisture has varied in space and time for multiple chaparral species, rather than a single generic “shrub fuel.” It reveals differences in how long each species stays wet or dry, how quickly they respond to changing weather, and how these patterns shift from year to year. Fire agencies can use this history to better judge when and where fire season begins and ends, researchers can explore how future climate could reshape flammability, and planners can ask whether promoting less flammable shrubs near communities might reduce risk. In short, the work turns scattered field samples and complex models into a practical map-based tool for understanding and managing wildfire danger in a region where fire is certain to remain a fact of life.
Citation: Varga, K., Jones, C. A 32-year species-specific live fuel moisture content dataset for southern California chaparral. Sci Data 13, 438 (2026). https://doi.org/10.1038/s41597-026-06794-3
Keywords: live fuel moisture, chaparral, wildfire risk, remote sensing, machine learning