Clear Sky Science · en
The Citizens Survey 2022-23: a household-level dataset on Universal Health Coverage in India
Why this nationwide health survey matters to everyday families
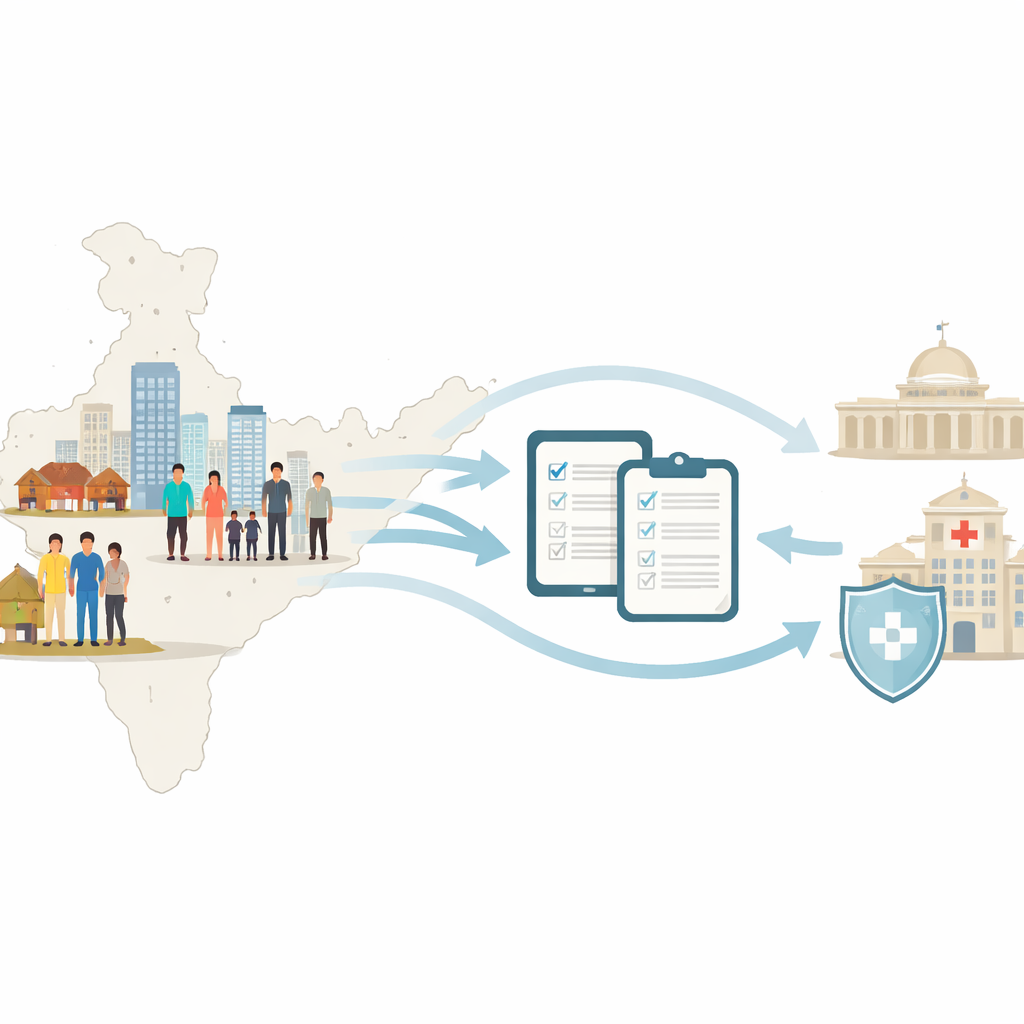
Across India, families routinely worry about how to pay for medical care, where to find trustworthy doctors, and whether government health schemes really work for them. Yet most official numbers come from hospitals and insurance records, not from people’s own voices. This article describes the Citizens Survey 2022–23, a massive effort that knocked on 50,000 household doors across the country to ask ordinary Indians how they actually experience and think about health care. The resulting dataset is a new public resource that can help redesign health services to match what people need and prefer.
Listening to people, not just counting hospital visits
Universal Health Coverage is the idea that everyone should be able to get good-quality care without being pushed into debt. India has launched many schemes toward this goal, but progress is usually measured from the top down—by tallying insurance cards, hospital admissions, or average state-level indicators. These figures miss key questions: Do people trust public clinics? Can they afford private hospitals? What role does health play when they vote? To fill this gap, the Lancet Commission on a Citizen-Centred Health System for India designed the Citizens Survey to capture citizens’ experiences, expectations, and priorities directly, at the household level.
Reaching homes across India’s varied landscape
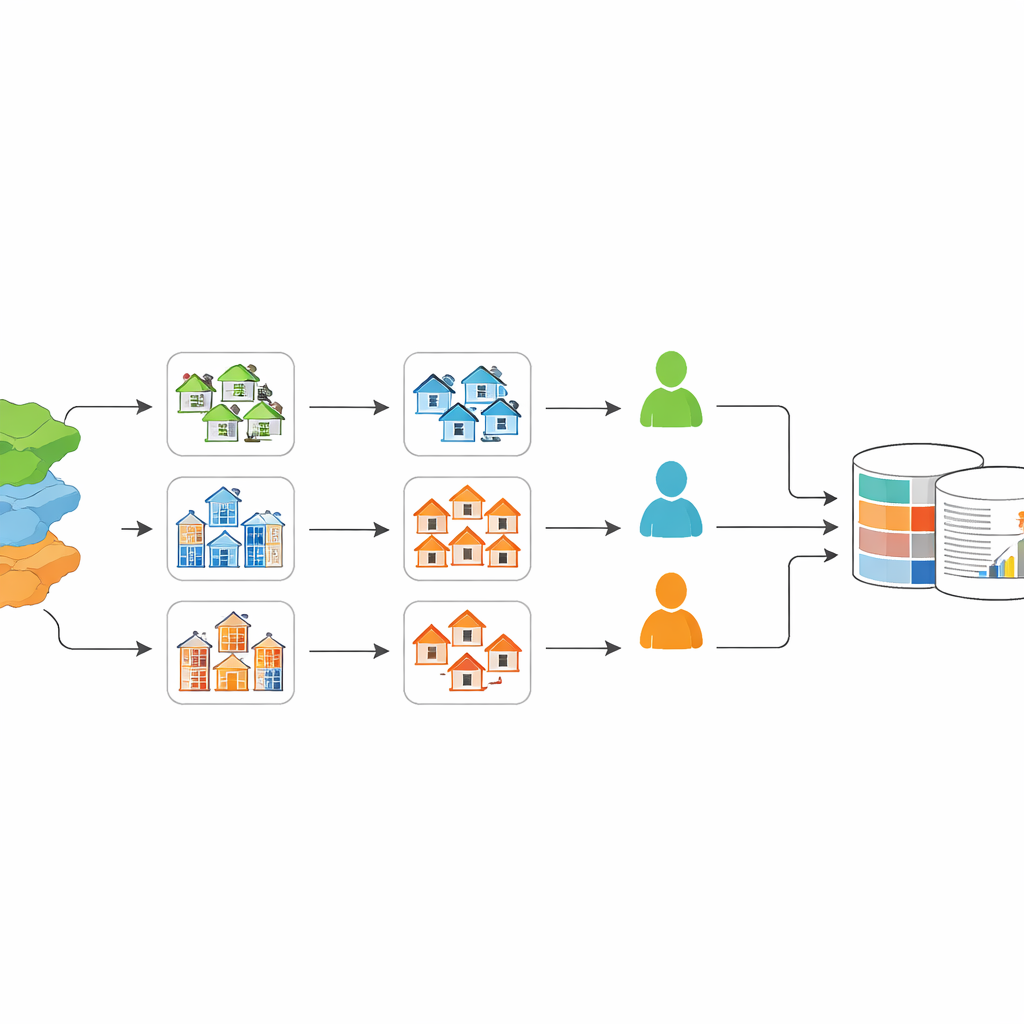
The survey team set out to paint a picture that reflects India’s huge diversity—spanning the country’s 28 states and 8 Union Territories, from remote rural villages to mega-cities such as Delhi, Mumbai, and Bengaluru. They selected 125 districts using a careful multi-step approach. Most districts were chosen randomly from an existing index that scores how well each district is doing on health coverage, ensuring that high-, middle-, and low-performing areas were all included. Additional large cities and some special study districts were added to capture India’s urban and political complexity. Within each district, villages and city wards were randomly picked, with extra attention to areas where historically disadvantaged communities such as Scheduled Castes and Scheduled Tribes live.
How households and people were chosen
Once a village or urban neighborhood was selected, surveyors used a systematic “every nth house” walk-through method to pick ten households in each area. From each chosen household, one person aged 15 or older was randomly selected using a standard grid method so that everyone had a fair chance of being interviewed. This process produced 50,000 respondents, 70% from rural areas and 30% from urban areas. Just over half of respondents were men, and nearly two in five households belonged to Scheduled Caste or Scheduled Tribe communities. The team designed a single, comprehensive questionnaire of 141 questions, translated into 18 Indian languages, and tested it in both paper and tablet-based pilots to make sure people understood the wording and flow.
What the survey asked and how quality was protected
The interview covered a wide range of topics: people’s recent visits to clinics and hospitals, what they spent, how long they waited, and how satisfied they were with care; their preferences between public and private providers; their health insurance status and willingness to pay; how they use phones and the internet for health information; and how much importance they place on health when choosing political leaders. Professional survey teams received intensive training, and supervisors routinely rechecked a share of interviews, listened to recordings, and ran quality checks on the tablet data. Participation was remarkably high—over 98% of approached households agreed to take part—and the final dataset has no missing responses because incomplete interviews were not kept.
Turning responses into a public resource
The researchers linked each household to basic geographic details, including village or ward names, map coordinates, and electoral constituencies, while stripping away names and other identifying information to protect privacy. The fully anonymized dataset, along with the questionnaire, codebook, and data-cleaning scripts, has been placed in a public online repository. The team also checked that their numbers made sense by comparing patterns with other national data—for example, confirming that urban households reported greater use of digital health tools, and that private-sector care was consistently more expensive than public-sector care.
What this means for people’s health and future policy
For non-specialists, the main takeaway is that India now has a large, detailed, and publicly available snapshot of how ordinary people experience health care and what they expect from it. Instead of relying only on hospital records or insurance counts, policy makers, researchers, and citizen groups can use this survey to see how access, costs, and preferences vary by district, social group, and rural–urban location. Over time, the dataset can serve as a yardstick to judge whether new schemes truly move the country closer to health care that is fair, affordable, and shaped by the voices of its citizens.
Citation: Kalita, A., Zadey, S., Shukla, S.K. et al. The Citizens Survey 2022-23: a household-level dataset on Universal Health Coverage in India. Sci Data 13, 444 (2026). https://doi.org/10.1038/s41597-026-06775-6
Keywords: universal health coverage, India health survey, healthcare access, household data, health policy