Clear Sky Science · en
MORICHI: a Dataset to Study Urban Overheating during Extreme Heat in a Hot-Summer Humid Continental Climate
Why Hot Cities Matter to Everyday Life
Across the world, people in cities are feeling hotter summers, and not just because of climate change. Streets, sidewalks, and buildings soak up the sun by day and slowly release that heat at night, turning neighborhoods into long-lasting hot spots. This extra warmth, layered on top of heat waves, can strain power grids, make homes uncomfortable, and endanger health—especially for vulnerable residents. Yet scientists often lack detailed, street-level measurements of how this heat builds up and where it is most intense. This paper introduces MORICHI, a new open dataset from Pittsburgh that captures both weather and infrared “heat pictures” of a city block during a real extreme heat event, giving researchers—and ultimately city planners and the public—new tools to understand and reduce dangerous urban heat.
How a Single Street Tells a Bigger Story
The study focuses on a typical street canyon on the campus of Carnegie Mellon University in Pittsburgh. Two mid-rise buildings flank a road with sidewalks, trees, and grass, forming a layout that closely resembles much of the city’s residential fabric. Pittsburgh sits in a hot-summer humid continental climate, a type shared by many regions in the northeastern United States, parts of Europe, and East Asia. Until now, there has been very little detailed heat data for such climates, even though they are expected to face more frequent and longer heat waves. By carefully instrumenting this one representative street, the researchers created a local laboratory whose lessons can be extended to other cities with similar weather and urban form.
Watching the Weather from a Walker’s Point of View
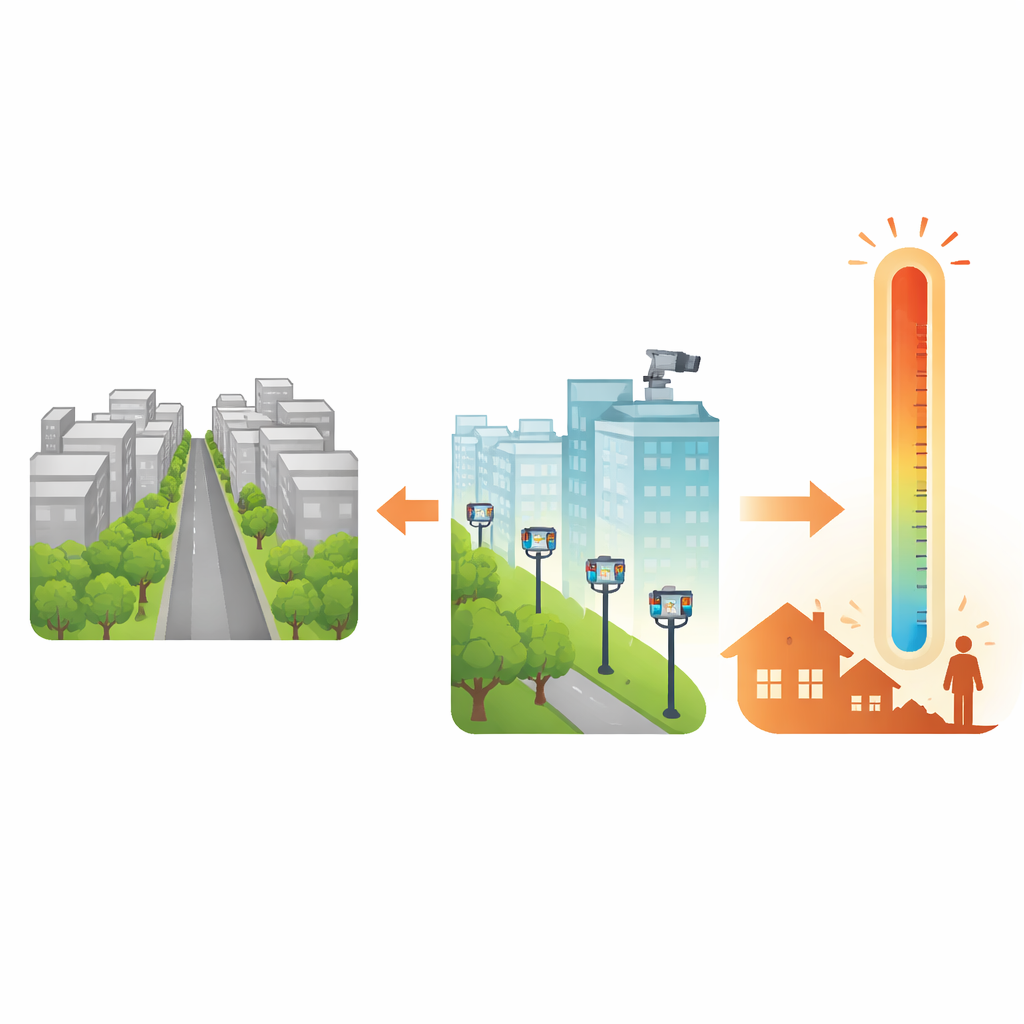
Four compact weather stations were installed two meters above the ground—roughly at the height of a person’s head—two in a garden area and two in the street canyon. Over nearly two months in the summer of 2024, they recorded air temperature, humidity, wind, rain, and comfort-related measures every five minutes. This period included an intense heat wave with afternoon temperatures reaching about 36 degrees Celsius and warm nights around 24 degrees. Because measurements were taken where people actually walk and sit, they capture the conditions that pedestrians and outdoor workers would feel, rather than the smoothed-out averages from tall rooftop towers or distant airports.
Taking the City’s Temperature One Pixel at a Time
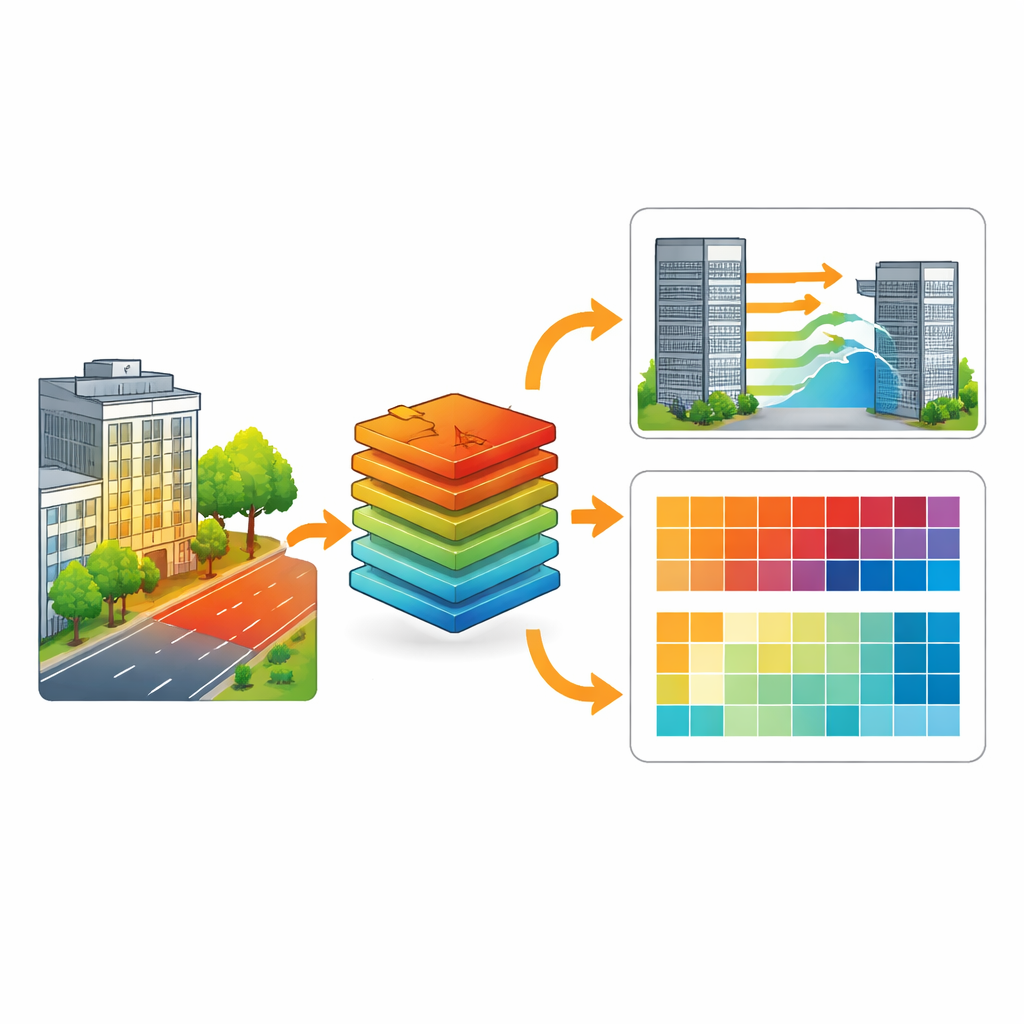
To see how different surfaces—road, sidewalks, brick walls, glass façades, trees, and even a rooftop cooling plant—heat up and cool down, the team mounted an infrared thermal camera high on a nearby building. The camera looked down on the street canyon and recorded a heat image every second, producing hundreds of thousands of frames over the campaign. Each pixel in these images corresponds to a small patch of surface with its own apparent temperature. A carefully shielded contact sensor on the sidewalk provided a “truth point” that allowed the researchers to calibrate the camera, keeping errors in surface temperature within about 1.7 degrees Celsius. Ethical checks and a distant viewing position ensured that people who appeared in the images could not be identified.
Turning Raw Measurements into a Shared Resource
The resulting MORICHI dataset adds up to more than a terabyte of information and is freely available under an open license in an international research data repository. Weather records are stored in simple table files, while thermal images are saved in specialized sequences that retain full radiometric detail and timing. A dedicated Python software library helps users line up the different time stamps, extract temperature series for specific surfaces, and process the images without needing proprietary tools. The authors tested the quality of the data, showing that both the weather measurements and the infrared images are stable over time and contain very little noise, even during the hottest days and nighttime hours.
What This Means for Cooler, Safer Cities
In practical terms, MORICHI gives scientists, engineers, and planners a detailed movie of how heat builds up and moves through a real city street during an extreme heat event. With it, they can check whether computer models of urban climate behave realistically, or train new data-driven methods to predict hot spots. They can compare the cooling power of trees and lawns against the warming effect of asphalt, traffic, and waste heat from machines on roofs. Insights from this dataset can help cities in similar climates design streets, buildings, and green spaces that stay more comfortable during heat waves, making urban life safer and more resilient as the planet warms.
Citation: Martin, M., Garcia-Sanchez, C., Stoter, J. et al. MORICHI: a Dataset to Study Urban Overheating during Extreme Heat in a Hot-Summer Humid Continental Climate. Sci Data 13, 404 (2026). https://doi.org/10.1038/s41597-026-06763-w
Keywords: urban heat, heat waves, thermal imaging, microclimate data, Pittsburgh