Clear Sky Science · en
A decade-long seamless-continuity daily L-band soil moisture product derived from SMOS observations since 2010
Why Tracking Wet and Dry Ground Matters
How wet the ground is just beneath our feet influences floods and droughts, crop yields, wildfire danger, and even day-to-day weather. Yet, despite fleets of Earth-observing satellites, our global maps of near-surface soil wetness are full of holes in space and time. This study presents a way to stitch those broken snapshots into a smooth, day-by-day picture of soil moisture across the planet, creating one of the most complete records yet of how Earth’s skin of soil has been drying and soaking since 2010. 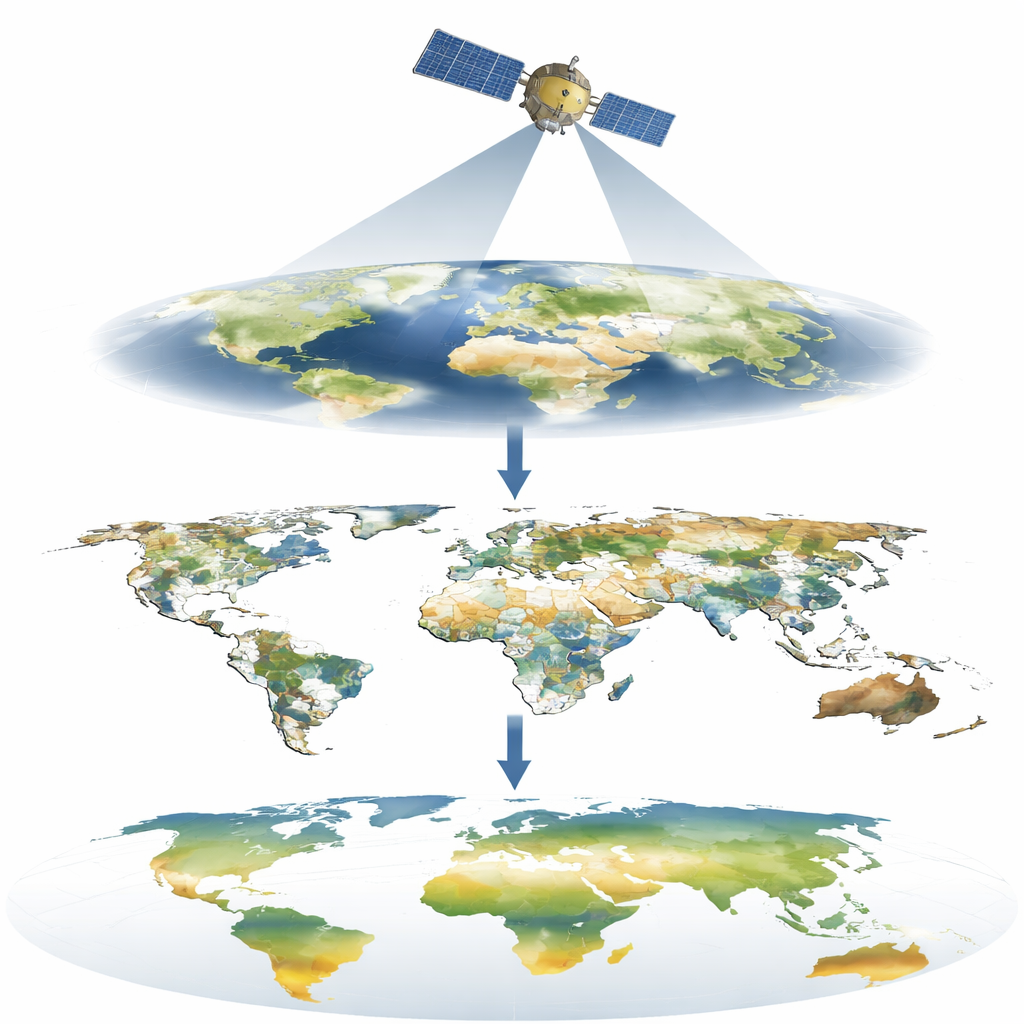
From Patchy Snapshots to a Daily Story
Satellites like Europe’s Soil Moisture and Ocean Salinity (SMOS) mission listen to naturally emitted microwave signals from Earth’s surface to infer how much water is stored in the top few centimeters of soil. In the low-frequency “L-band,” these signals can see through light to moderate vegetation and are particularly sensitive to soil wetness, making them a gold standard for hydrology and climate studies. But practical problems—such as the path a satellite takes around Earth, occasional instrument glitches, radio interference from human transmitters, and difficulties in separating soil and vegetation effects—leave many blank pixels in the daily maps. For a single year, fewer than half of the land pixels might have a valid observation on any given day, breaking up the continuous picture that climate and water models need.
A Smart Way to Fill in the Blanks
To tackle these gaps, the authors use a reconstruction approach called DCT-PLS, which combines two ideas: representing patterns as smooth waves and learning how neighboring points in space and time relate to each other. Instead of relying on extra inputs like rainfall data or vegetation maps—which bring their own errors—the method works only with the soil moisture data themselves. It takes advantage of the fact that soil wetness usually changes gradually over time and tends to be similar across nearby locations. By expressing the data as combinations of simple waves and then smoothing them while respecting these relationships, the method can infer missing values in a way that is consistent with both the local landscape and the broader seasonal rhythm.
Putting the Method to the Test
Before trusting the reconstructed maps, the team performs a series of reality checks. First, they create artificial gaps in real ground-based measurements from 22 soil moisture monitoring networks on five continents, then see whether the method can recover the hidden values. It does so remarkably well: for most sites, the reconstructed time series closely tracks the actual measurements, catching the swings between dry winters and wet summers with very small typical errors. Next, they “punch holes” into existing satellite maps—removing data over several large test regions across the globe—and then reconstruct those missing areas. The filled-in scenes line up closely with the original maps, preserving not just average values but also the spatial texture of wetter valleys and drier uplands, and avoiding unnatural edges where original and reconstructed data meet. 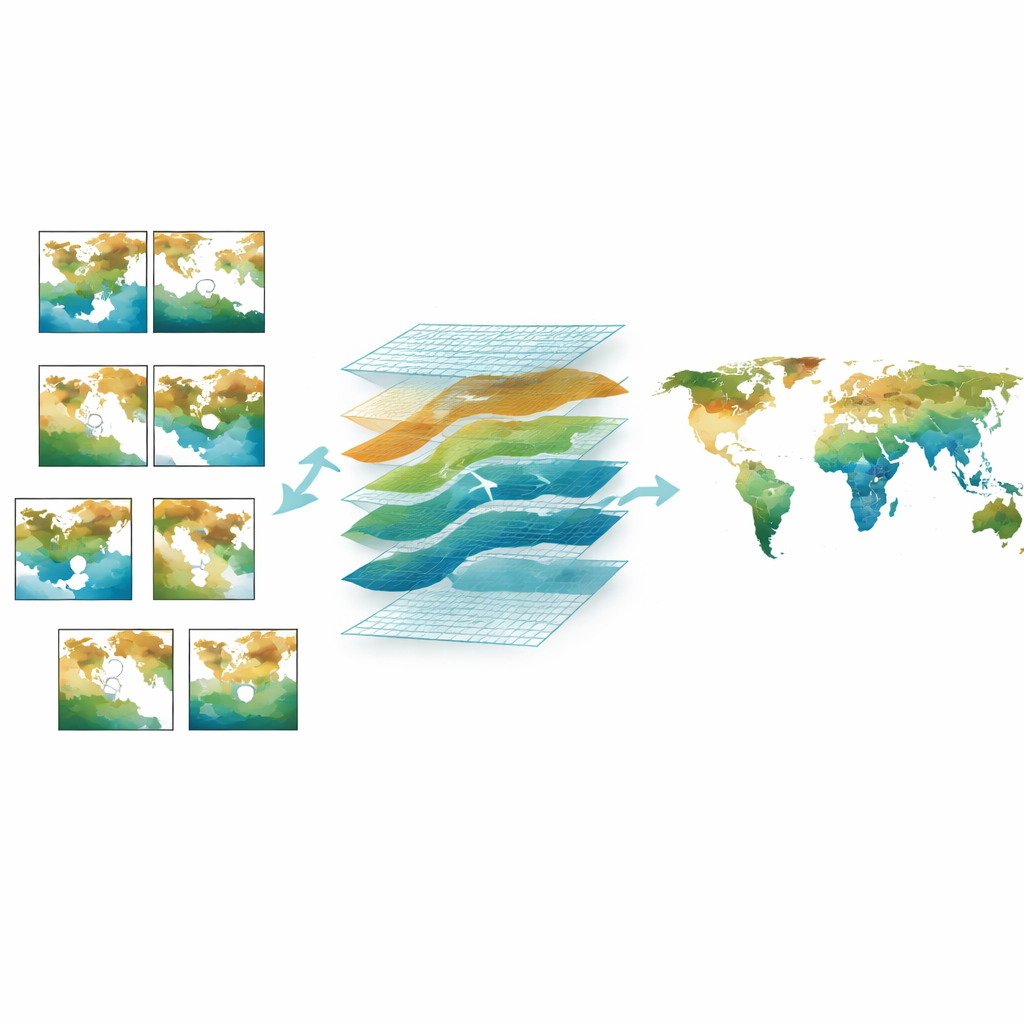
A New Global Picture of Soil Wetness
Armed with these tests, the researchers apply DCT-PLS to the entire archive of SMOS soil moisture maps produced with a multi-temporal, multi-angle processing method. The result is a “seamless-continuity” product: a decade-long record from mid-2010 to the end of 2020, with daily coverage at a grid spacing of about 25 kilometers over almost all land areas where soil moisture can be observed. Every land pixel now has a value for every day, turning a patchwork into a complete movie of how soil wetness evolves. When compared with ground stations, the new gap-free product performs about as well as the original satellite retrievals, with typical differences on the order of a few hundredths of a cubic meter of water per cubic meter of soil. Importantly, the reconstruction maintains realistic seasonal cycles and regional contrasts—such as strong wet–dry swings in monsoon regions and smaller variations in tropical forests.
What This Means for Climate and Water Studies
For non-specialists, the key outcome is straightforward: scientists now have a reliable, globally complete, day-by-day record of near-surface soil wetness from an especially informative microwave band. This dataset makes it easier to study long-term drying or moistening trends, track droughts and recoveries, and test how well climate and land-surface models capture water movement through the landscape. The approach is not perfect—it can smooth over sudden changes from storms or irrigation—but it greatly reduces the blind spots that once hampered global soil moisture research. In doing so, it lays a stronger observational foundation for understanding how a warming climate is reshaping the world’s water cycle.
Citation: Bai, Y., Jia, L., Zhao, T. et al. A decade-long seamless-continuity daily L-band soil moisture product derived from SMOS observations since 2010. Sci Data 13, 425 (2026). https://doi.org/10.1038/s41597-026-06756-9
Keywords: soil moisture, satellite remote sensing, gap filling, climate data, hydrology