Clear Sky Science · en
A 500-m Agricultural Drought Impact Dataset in China’s Main Grain Region: Toward Impact-Based Drought Monitoring
Why mapping farm drought really matters
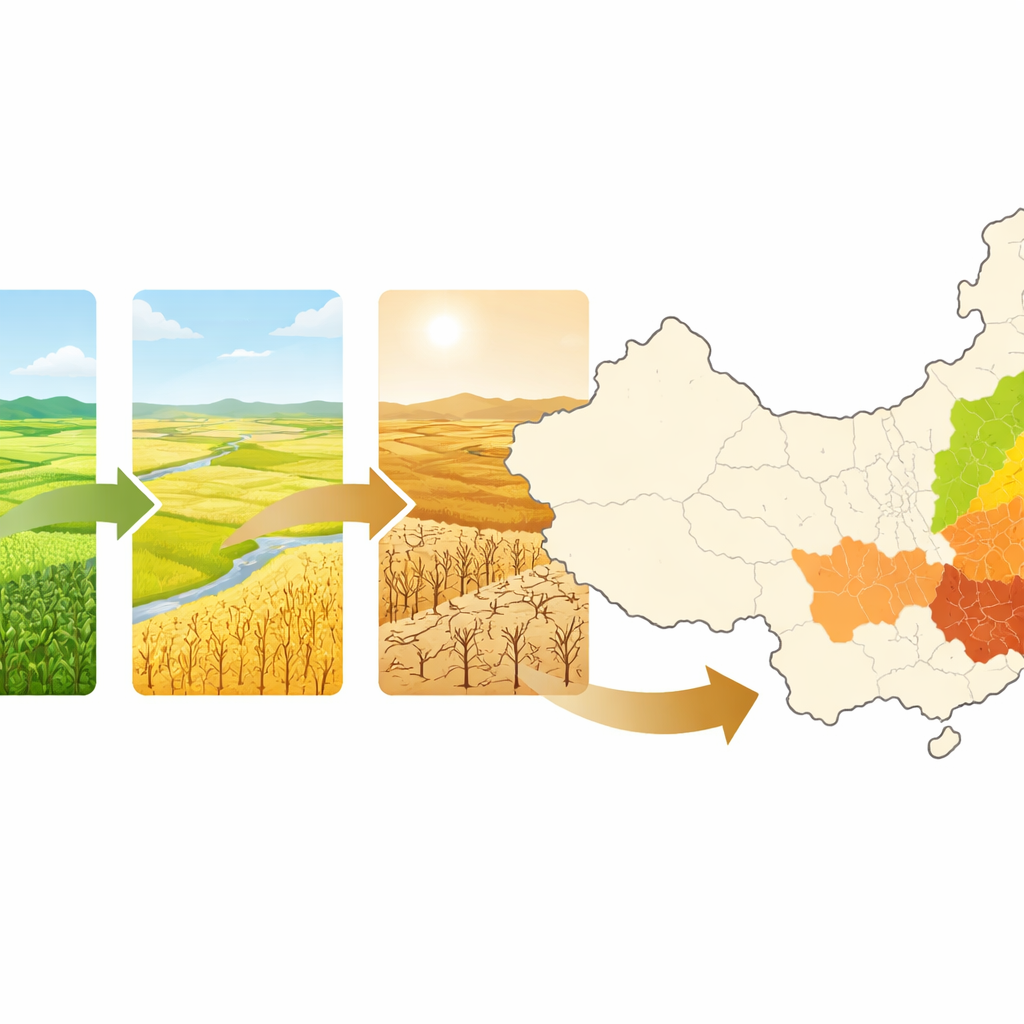
Droughts rarely make headlines the way hurricanes or floods do, but they quietly cut into global food supplies year after year. In China, which grows grain to help feed nearly a fifth of the world’s people, knowing exactly where crops are suffering from lack of water is crucial for keeping food on tables and guiding relief efforts. This study presents a new, detailed map-based dataset that shows, field by field, how severely drought has affected major crops in China’s main grain regions over 15 years.
Seeing drought through the eyes of crops
Traditional drought information often focuses on weather—rainfall totals, river levels, or soil moisture. That helps to track the hazard, but it does not directly show what farmers care about most: how much of their land is actually losing yield. Existing impact records in China come from text reports and province-level statistics, which are useful but too coarse to reveal local hot spots or differences between crop types. The authors tackle this gap by turning to satellites that continuously watch how lush or sparse plant leaves are across the landscape. Instead of measuring rainfall, they watch the crops themselves and ask: where are they falling behind compared with good years?
Turning leaf greenness into impact maps
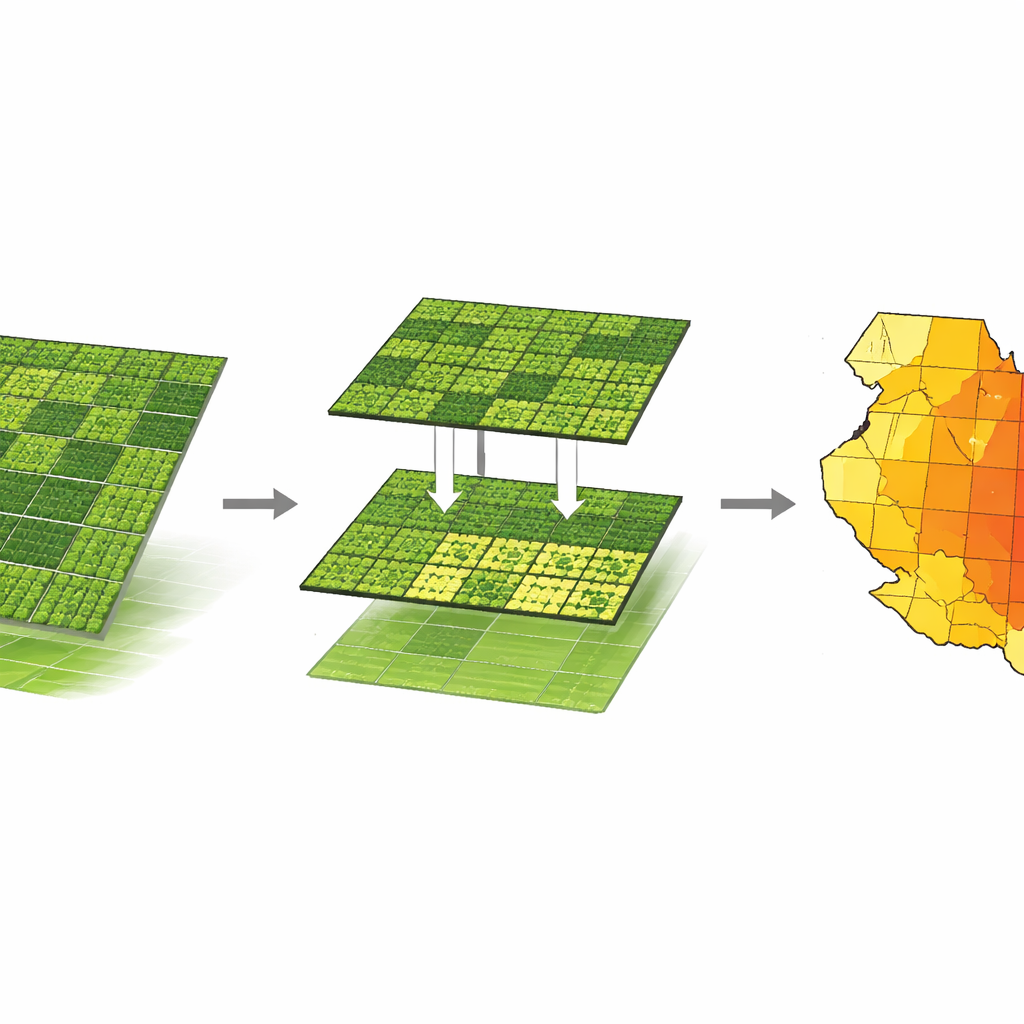
The team builds on a plant growth measure known as the leaf area index, which essentially captures how much green leaf surface is present over each patch of land. Using data from NASA’s MODIS instrument, they track this signal every eight days at a resolution of 500 meters—fine enough to distinguish patterns within counties and river basins. For each province and for key crop seasons—summer-harvest grains, autumn-harvest grains, and early rice—they identify the most sensitive growth window, when water shortages hurt yields the most. They then choose a recent year with unusually mild drought as a “near-ideal” baseline, and compare leaf conditions in all other years to this benchmark.
From subtle stress to crop failure
To make the maps meaningful for decision makers, the authors anchor their satellite analysis to official historical statistics that report how much cropland experienced slight, serious, or disastrous drought impacts each year. By systematically adjusting relative thresholds—how far leaf conditions can fall below the baseline before a location is considered impacted—they find the values that best match the reported areas over time. The result is a set of yearly, 500-meter maps across 13 key provinces (plus Chongqing) that classify each grid cell into one of three impact levels: drought-affected, drought-damaged, or crop failure. These maps reveal how drought stress shifts among the Northeast, the Huang–Huai–Hai plains, and the Yangtze River Basin, and how the most severe impacts cluster in particular subregions and years.
Checking the picture against on-the-ground stories
Because detailed local yield loss data are scarce, the authors validate their maps using descriptive reports from China’s national flood and drought bulletins and other published studies. They examine several well-documented severe drought years and compare reported trouble spots with the new impact maps. In years like 2006, 2007, 2009, 2011, 2014, and 2016, the mapped high-impact areas line up with narrative accounts of withered crops in parts of Heilongjiang, Jilin, Liaoning, Inner Mongolia, Hebei, Henan, Sichuan, Chongqing, and Hubei. Statistical checks also show strong agreement between extracted and reported impact areas, especially for the most severe category, where plant stress is most obvious from space. Some provinces with complex crop mixes, such as Hunan and Jiangxi, remain more challenging, highlighting where better crop maps and field data are still needed.
What this new tool can and cannot tell us
The authors emphasize that leaf signals are influenced not only by drought but also by pests, storms, and other stresses, and that their moderate resolution can blend different crops within a single pixel. They also had to simplify many different crops into three broad groups and assume common key growth stages, especially in regions with diverse planting patterns. Even so, the broad spatial patterns closely match independent records, suggesting that the dataset reliably captures where and when water shortage has been the dominant problem. The maps are freely available and can be used to assess drought risk, track how often specific areas are hit, test early-warning systems, evaluate farming vulnerabilities, and design more targeted water and relief policies.
Bringing drought impacts into sharper focus
In everyday terms, this work turns scattered reports and coarse statistics into a detailed, year-by-year picture of where crops in China have actually suffered from drought and how badly. Instead of only knowing that a province had a “bad drought year,” planners can now see which valleys, plains, and river basins repeatedly tip from mild stress into widespread crop failure. That level of detail is essential for moving from simply knowing that drought is coming to understanding what it will do on the ground—and for taking smarter, more local actions to protect harvests and livelihoods.
Citation: Shi, J., Sang, YF., AghaKouchak, A. et al. A 500-m Agricultural Drought Impact Dataset in China’s Main Grain Region: Toward Impact-Based Drought Monitoring. Sci Data 13, 357 (2026). https://doi.org/10.1038/s41597-026-06732-3
Keywords: agricultural drought, remote sensing, China grain production, crop monitoring, climate impacts on agriculture