Clear Sky Science · en
A 10 m maize, rice and soybean yield dataset from 2016 to 2021 in Northeast China
Why this crop map matters to everyday life
How much food can a region grow, and how does that change from year to year? These questions lie at the heart of food prices, farm livelihoods, and national food security. This study delivers an unusually detailed picture of maize, rice, and soybean harvests across Northeast China, one of the country’s breadbaskets, by mapping crop yields every 10 meters from 2016 to 2021. The result is like switching from a blurry satellite image of food production to a crisp close-up, revealing field‑by‑field differences that were previously invisible.
From rough estimates to fine‑grained views
For years, researchers have used satellites and statistics to estimate how much food is produced around the world. Existing datasets cover vast areas, but usually at coarse scales—tens of kilometers per pixel—so a single value can blend many farms with very different growing conditions. That may be good enough for national summaries, but it obscures local problems such as poor drainage, uneven fertilizer use, or storm damage. This limitation is especially serious in China, where farms are often small and management practices vary sharply over short distances.
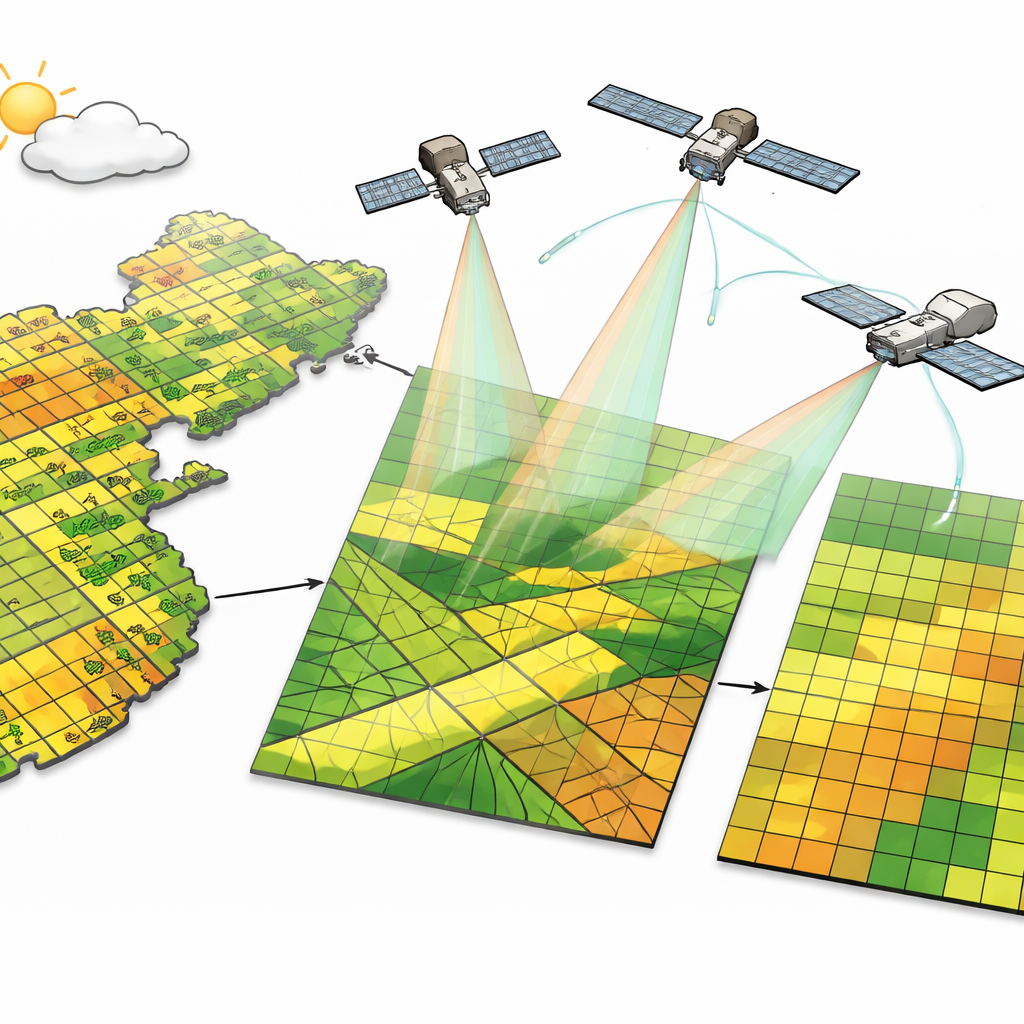
A new way to read crops from space
To sharpen the picture, the authors combined images from the European Sentinel‑2 satellites, weather data, and detailed maps of where maize, rice, and soybean are planted. They built on a family of models that estimate plant growth from sunlight and environmental conditions, focusing on how much useful light crops actually absorb and turn into biomass. Instead of relying on many hard‑to‑measure field parameters—such as exact plant carbon content or maximum light efficiency—they introduced two key ideas: a dynamic index that captures the effective sunlight available for photosynthesis under real conditions, and a single conversion factor that translates that energy into yield. This allowed them to estimate harvests without collecting costly measurements from each field.
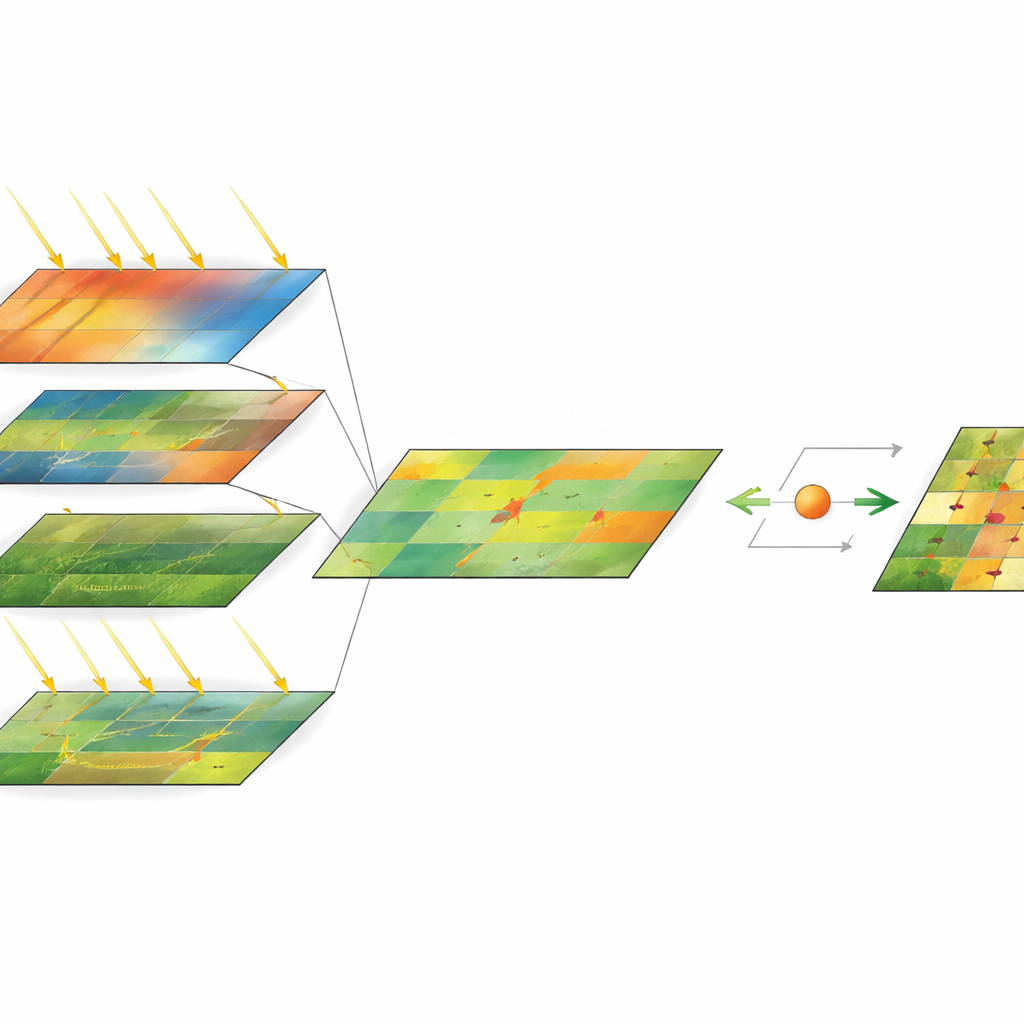
Turning light and weather into harvest maps
The new index tracks how much incoming light is absorbed by green leaves after adjusting for temperature, plant growth stage, and water stress. These ingredients are all derived from satellite‑based vegetation signals and weather records. The conversion factor, calibrated separately for each city, links this energy metric to reported harvests between 2016 and 2021. By summing the energy index over the growing season and applying the calibrated factor, the model produces yield estimates for every 10‑meter pixel across the three northeastern provinces. The team then checked these estimates against both government statistics and field measurements from research stations.
How well does it work?
The method captured broad yield patterns for all three crops and outperformed earlier approaches that depended on more rigid assumptions. For maize, rice, and soybean, the model’s predictions showed moderate to strong correlation with official statistics and field data, while typical errors were around 12–14 percent in medium‑ to high‑yield areas. When compared to widely used global products at 10‑kilometer resolution, the new 10‑meter maps not only matched overall levels better but also described local differences more faithfully. The authors highlight that performance is strongest in regions with relatively stable, well‑managed cropping systems and somewhat weaker where yields are low or highly variable, such as areas affected by pests, poor soils, or extreme weather.
What the maps reveal about a key grain region
The six‑year series of maps shows how production of maize, rice, and soybean is distributed across Northeast China and how it changes over time. Maize yields generally decline from east to west, rice from west to east, and soybean from south to north, reflecting differences in climate, soils, and farming practices. Year‑to‑year shifts in these patterns line up with county‑level statistics and point to the influence of unusual events like floods or droughts. Because the maps resolve individual fields, they can also expose subtle management differences within the same county—insights that are invisible in coarser national or provincial data.
What this means for farmers and food security
In plain terms, this work offers a high‑definition, region‑wide crop report card that updates each year. Policymakers can use it to spot vulnerable areas, design more targeted support, and plan grain reserves or trade more confidently. Insurers and lenders can better assess risk at the level of clusters of fields rather than whole counties. Researchers can track long‑term yield trends and test how climate variability or new practices affect productivity. While the authors caution that the maps are most reliable in medium‑ and high‑yield zones and are not yet a replacement for field‑scale management decisions, they mark a major step toward affordable, consistent, and detailed monitoring of staple crops in one of China’s most important grain‑producing regions.
Citation: Teng, F., Wang, M., Shi, W. et al. A 10 m maize, rice and soybean yield dataset from 2016 to 2021 in Northeast China. Sci Data 13, 344 (2026). https://doi.org/10.1038/s41597-026-06719-0
Keywords: remote sensing agriculture, crop yield mapping, Northeast China grain, maize rice soybean, food security monitoring