Clear Sky Science · en
Spatially explicit datasets of pesticide inputs integrating 146 active ingredients in China from 2001 to 2022
Why this matters for food and rivers
Pesticides help protect crops and keep food affordable, but they can also leak into soils, rivers, and drinking water. In China, one of the world’s largest pesticide users, it has been surprisingly hard to know exactly where and how much of each chemical is being used. This study builds a detailed, map-based dataset of pesticide use across China over two decades, giving policy makers, scientists, and the public a new way to see the hidden footprint of modern farming.
From one big number to a detailed picture
Until now, official statistics in China largely reported pesticides as a single, total amount—the sum of hundreds of different ingredients with very different toxicities and behaviors in the environment. That is like knowing how many medicines a country uses without knowing which drugs they are. The authors set out to fill this gap by creating a national, ingredient-by-ingredient record of pesticide inputs, broken down by crop type and location from 2001 to 2022. Their goal was to deliver a freely available resource that makes it possible to assess environmental risks in a much more realistic way and to design targeted control strategies instead of one-size-fits-all rules.
Listening to farmers and learning patterns
The project began with field surveys of more than a thousand farmers across major agricultural regions in China, covering 12 important crop systems such as rice, wheat, maize, vegetables, tea, and fruits. Farmers were asked what products they sprayed, how often, at what doses, and on how much land. From these answers, the team calculated how much of each active ingredient was applied per area for each crop. They found that, within a given crop, farmers tend to rely on a fairly stable “ranking” of ingredients: a few are used heavily, others in smaller amounts, forming a predictable pattern. Drawing on ideas from economics, ecology, and systems thinking, the authors treated this ranking and the relative shares among ingredients as a kind of fingerprint for pesticide use in each crop system.
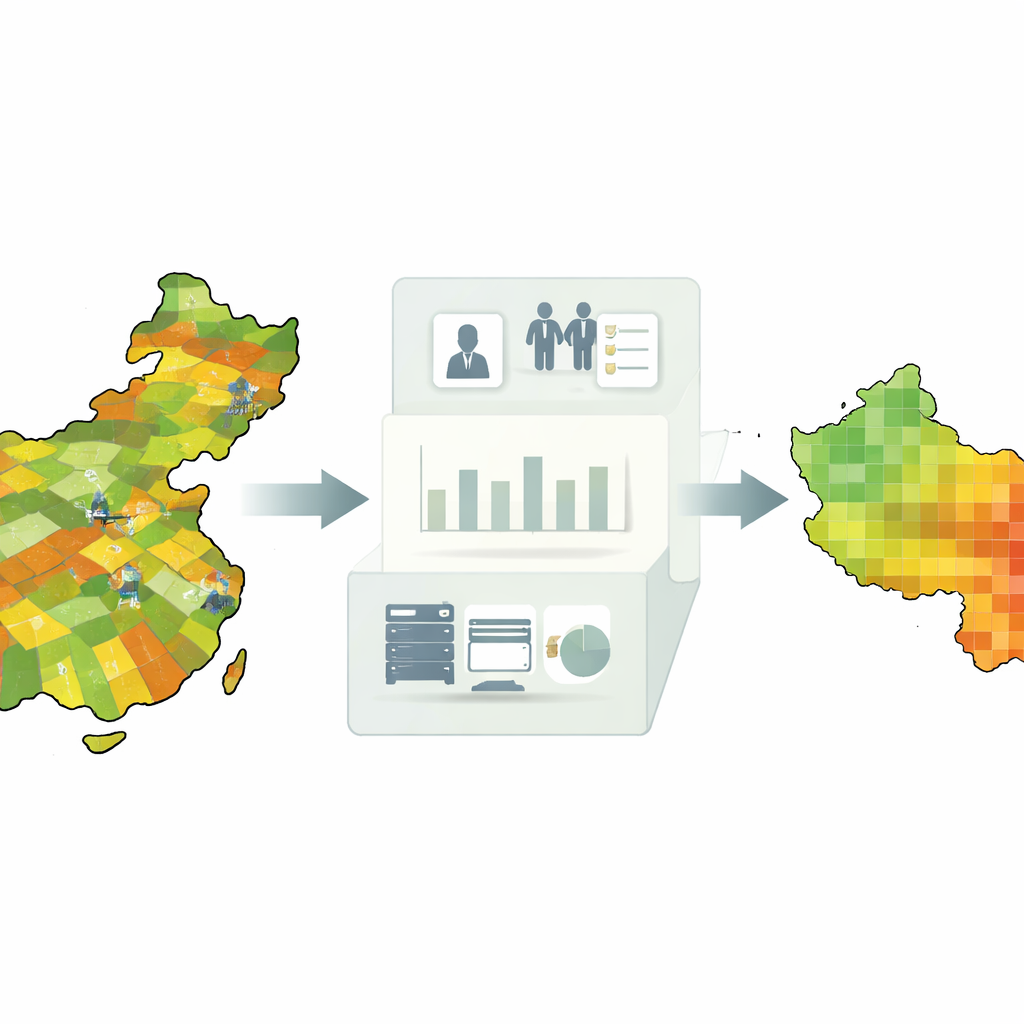
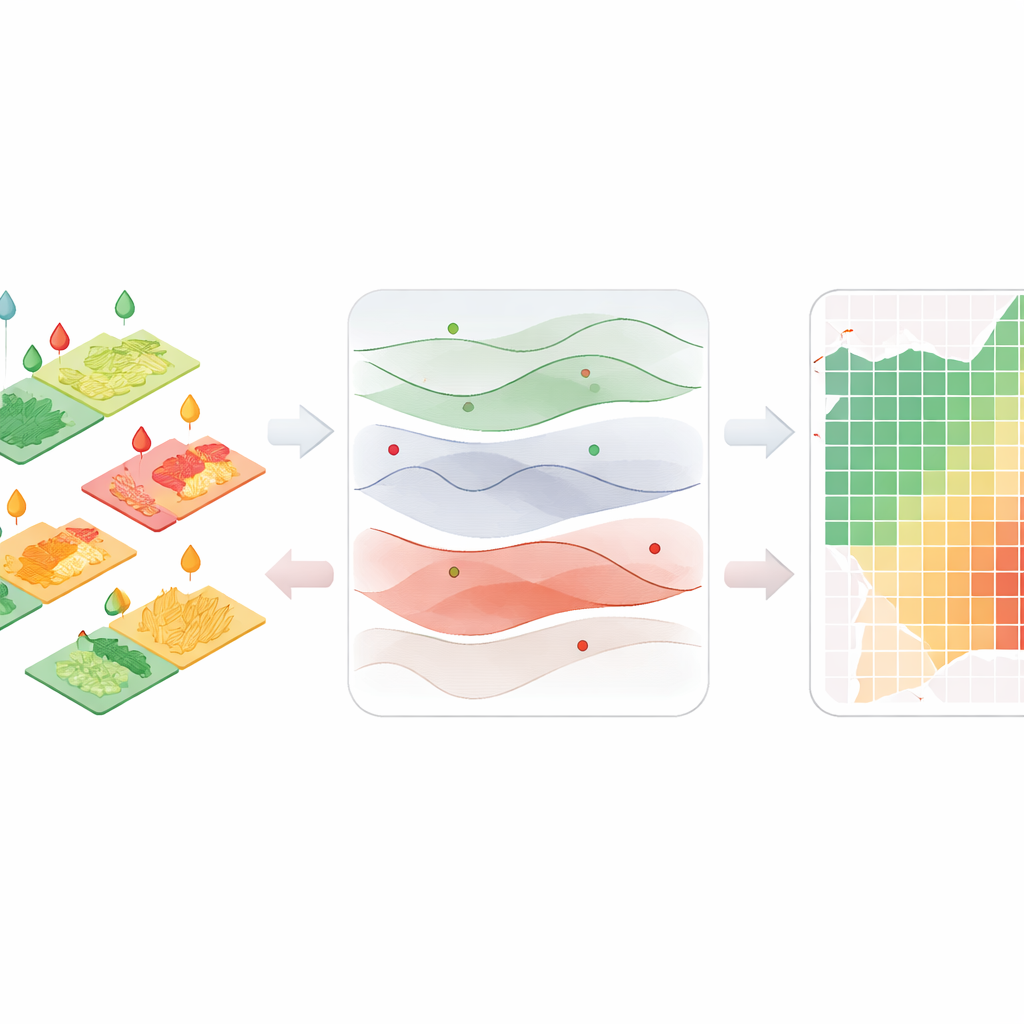
Turning scattered information into national maps
To extend these fingerprints across space and time, the researchers combined several kinds of information. They tracked when each pesticide was officially approved or banned, and how recommended doses changed over time. They used statistical techniques to link these timelines with the survey-based fingerprints, generating yearly input estimates for 146 different ingredients. Next, they adjusted these estimates so that, when summed up, they matched national and provincial statistics on total pesticide use. Finally, they overlaid the results on detailed maps of harvested areas for each crop, at a grid size of roughly 10 by 10 kilometers. The result is a set of high-resolution maps showing how the use of different pesticide groups—such as organophosphates, neonicotinoids, and triazoles—has shifted across China’s landscapes between 2001 and 2022.
Checking the maps against real rivers
Because China does not publish ingredient-specific sales or application records, the team could not validate their maps directly against official use numbers. Instead, they tested whether their estimated inputs could reproduce measured pesticide levels in rivers. Using a widely applied runoff model, they translated their mapped inputs into expected concentrations in river water, taking into account rainfall, slopes, plant cover, and simple assumptions about how chemicals wash off fields. They then compared these predictions to hundreds of real measurements from China’s national water quality monitoring network in the Yangtze River Basin. For most pesticides and locations, predicted and measured concentrations matched within the same order of magnitude, and the model correctly anticipated whether a specific ingredient would be present in a river about two-thirds of the time.
What this means for people and policy
For non-specialists, the key outcome is not a new risk estimate but a new lens. Instead of a single national total, we now have a year-by-year, map-based view of where particular pesticides are likely entering the environment in China. This makes it possible to pinpoint hotspots, track shifts from older to newer chemicals, and link farming practices to river pollution in a much more concrete way. The authors designed their dataset and computer code to be updated each year as new survey data come in. That means regulators, researchers, and local authorities can use this work as a living foundation for safer pesticide management—aiming to keep crop protection benefits while reducing hidden costs to ecosystems and human health.
Citation: Zhang, B., Mu, H., Li, H. et al. Spatially explicit datasets of pesticide inputs integrating 146 active ingredients in China from 2001 to 2022. Sci Data 13, 380 (2026). https://doi.org/10.1038/s41597-026-06704-7
Keywords: pesticides, China agriculture, environmental monitoring, river pollution, spatial datasets