Clear Sky Science · en
A global dataset of spatiotemporal co-occurrence patterns of avian influenza virus-associated migratory birds
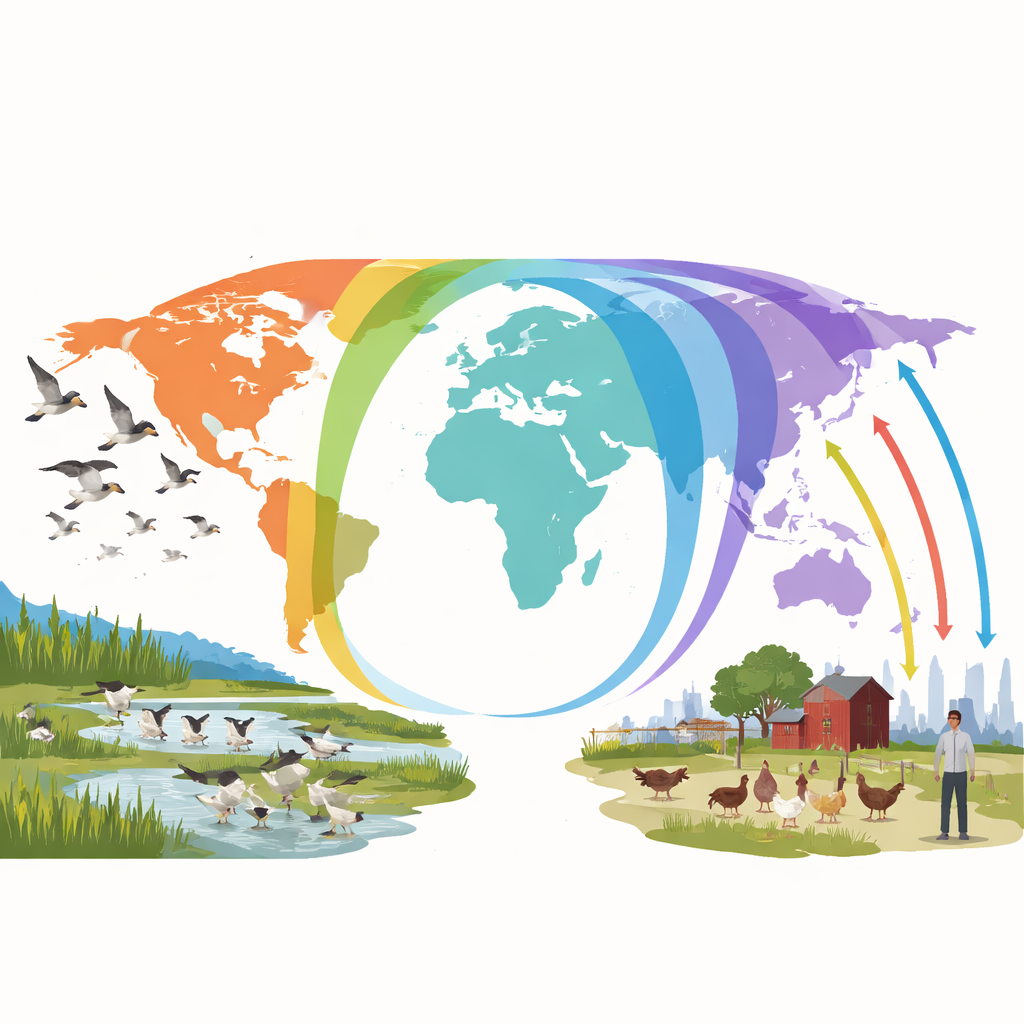
Why bird journeys matter for our health
Every year, vast flocks of ducks, geese, shorebirds and gulls crisscross the globe on long migrations. These journeys are awe‑inspiring, but they also create moving meeting points where birds can share viruses such as avian influenza. The study behind this article pulls together tracking data from thousands of individual birds worldwide to map when and where different species travel together. By turning scattered movement records into a global, day‑by‑day picture of bird gatherings, the authors provide a new tool for spotting places and seasons where dangerous flu strains are most likely to emerge and spread.
Following birds across continents
Modern tracking devices, from satellite tags to tiny GPS loggers, have transformed how scientists follow animal movements. Yet most tracking projects focus on just one species at a time. That makes it difficult to see how different kinds of birds overlap in space and time, a key ingredient for a virus to jump between hosts and evolve. The researchers tackled this gap by mining Movebank, a large public database of animal tracking studies. From a previously compiled list of 175 wild bird species known to carry avian influenza, they obtained detailed movement records for 62 species, covering 3,944 individual birds drawn from 157 separate projects around the world.
Turning messy tracks into shared stopovers
Raw tracking data are uneven and noisy: some birds are recorded every few minutes, others only a few times a day, and locations can fall at sea or on land. The team first cleaned and standardized these records. They kept only terrestrial locations within political land boundaries, resampled positions to regular hourly steps, and filtered out individuals with long gaps in their tracks. Then they used a clustering method that looks at both space and time to pick out true stopover sites—places where a bird lingers, rather than just passing overhead. For tracks that were too sparse for clustering, they instead measured how long each bird stayed within each region it visited.
Building a calendar of bird meetings
With cleaned tracks and identified stopovers, the authors created a global “co‑occurrence” dataset. This records, for each day of the year and each first‑level administrative region (such as a province or state), which bird species were present together. From these daily species lists they calculated all possible species pairs and counted how often each pair shared the same region on the same date. The final dataset spans 488 regions and includes 50 migratory bird species that actually overlapped in this way, forming 385 unique species pairs across 77,862 daily records. Summary tables show how many species and pairs occur in each region, how frequently they meet, and in which months gatherings peak, revealing clear geographic clusters and strong seasonal patterns in bird mixing.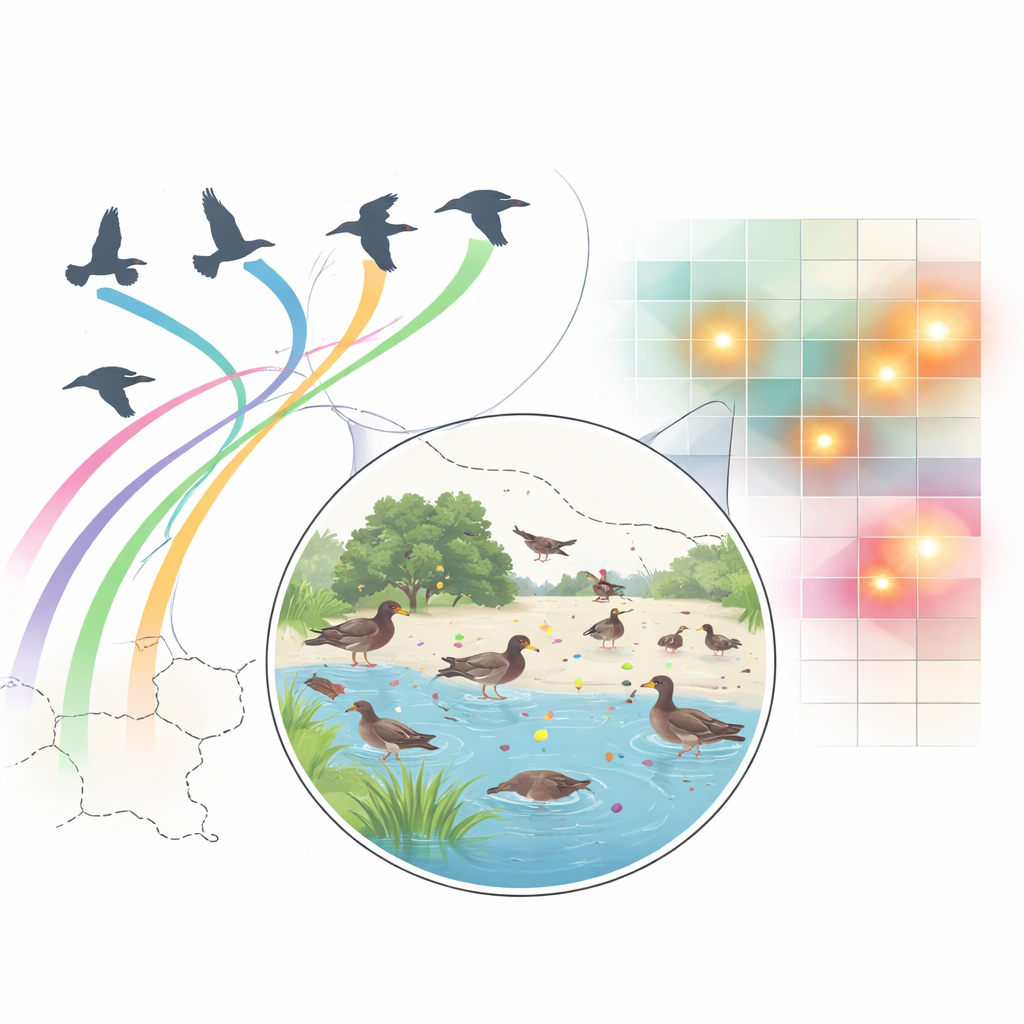
Checking that hotspots are real
To test whether these apparent hotspots reflect real viral risk rather than quirks of sampling, the team ran several checks. They repeated their analyses with a much broader set of 143 tracked migratory bird species, not just those already known to carry avian influenza. The regions and months with the highest co‑occurrence intensity barely changed, suggesting that the main hotspots are robust even as new host species are added. They then went a step further by examining virus genetic data from two frequently co‑occurring gull species in European hotspots. In both the Netherlands and Belgium, virus samples collected from these species at predicted co‑occurrence times were more than 99% similar across key gene segments, strong evidence that the birds were sharing viruses where and when the tracking data said they met.
Using the map while minding its limits
The resulting dataset is openly available and designed for many uses. Disease researchers can use it to prioritize where to look for new flu strains, by focusing on regions with many species pairs and days of co‑occurrence, and on particular species pairs that repeatedly meet across borders. Wildlife managers and conservation planners can use the same information to place monitoring stations in busy migratory hubs and to time fieldwork to match peak bird gatherings in different months. At the same time, the authors stress several caveats: tracked birds may not fully represent their species, tracking effort is concentrated in certain flyways, and co‑occurrence is defined by political regions that do not always match ecological boundaries. Missing data in some areas likely reflect a lack of tracking rather than a lack of bird interactions.
What this means for people and birds
By weaving thousands of individual flight paths into a single global picture, this study offers a powerful new lens on how migratory birds can move avian influenza across continents. It does not predict exactly when or where the next outbreak will occur, but it highlights the regions and seasons where virus exchange between species is most plausible. In doing so, it provides a practical roadmap for smarter surveillance of both wild birds and poultry, helping health authorities and conservationists focus limited resources where they are most likely to make a difference. As tracking technology expands to more species and regions, this kind of co‑occurrence mapping could become a cornerstone of early warning systems for emerging bird‑borne diseases.
Citation: Ma, J., Wang, YH., Qiu, YB. et al. A global dataset of spatiotemporal co-occurrence patterns of avian influenza virus-associated migratory birds. Sci Data 13, 342 (2026). https://doi.org/10.1038/s41597-026-06701-w
Keywords: migratory birds, avian influenza, animal tracking, disease hotspots, wildlife surveillance