Clear Sky Science · en
Global emission factor dataset for Scope 3 machine learning applications
Why Tracking Hidden Carbon Matters
Most of the climate impact of modern companies comes not from their own smokestacks, but from long, tangled supply chains—everything they buy, sell, ship, and outsource. These so‑called “Scope 3” emissions are notoriously hard to track. The paper introduces ExioML, an open global dataset and toolkit that turns decades of complex economic and environmental records into machine‑learning‑ready data. This makes it much easier for researchers, policymakers, and businesses to estimate where emissions are really coming from, compare methods fairly, and design smarter climate solutions.
Seeing the World Economy as a Web
At the heart of ExioML is a way of looking at the world economy as a giant web of industries trading with one another across borders. Instead of just counting how much carbon is released within a country, this approach follows the trail of emissions along supply chains: from raw materials, to factories, to shops, and finally to consumers. Existing databases that do this are powerful but often locked behind paywalls, tricky to use, or out of date. The authors build on one of the most detailed open resources, EXIOBASE, and reorganize it so that anyone can easily ask questions like: how much greenhouse gas is tied to steel production in a given country and year, or how emissions in one region are embedded in products consumed elsewhere.
Turning Raw Numbers into Ready‑to‑Use Data
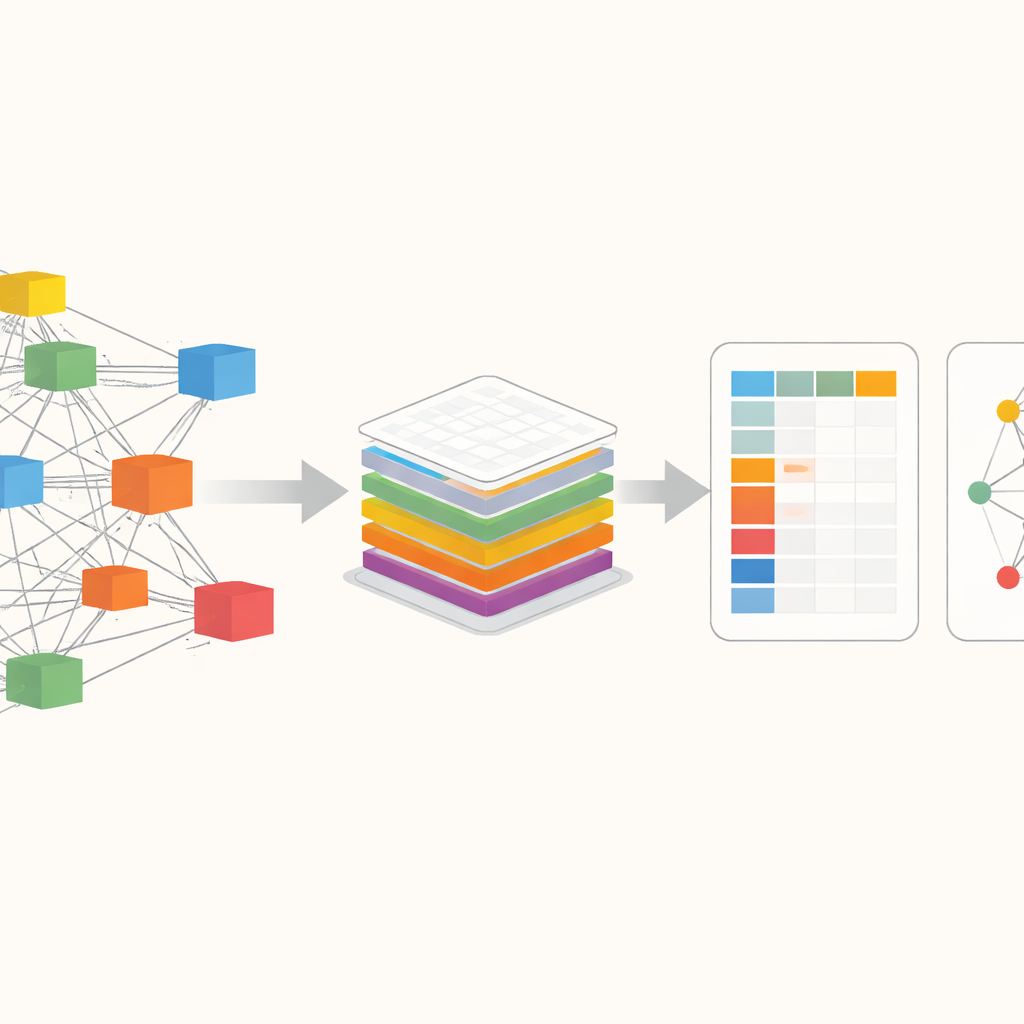
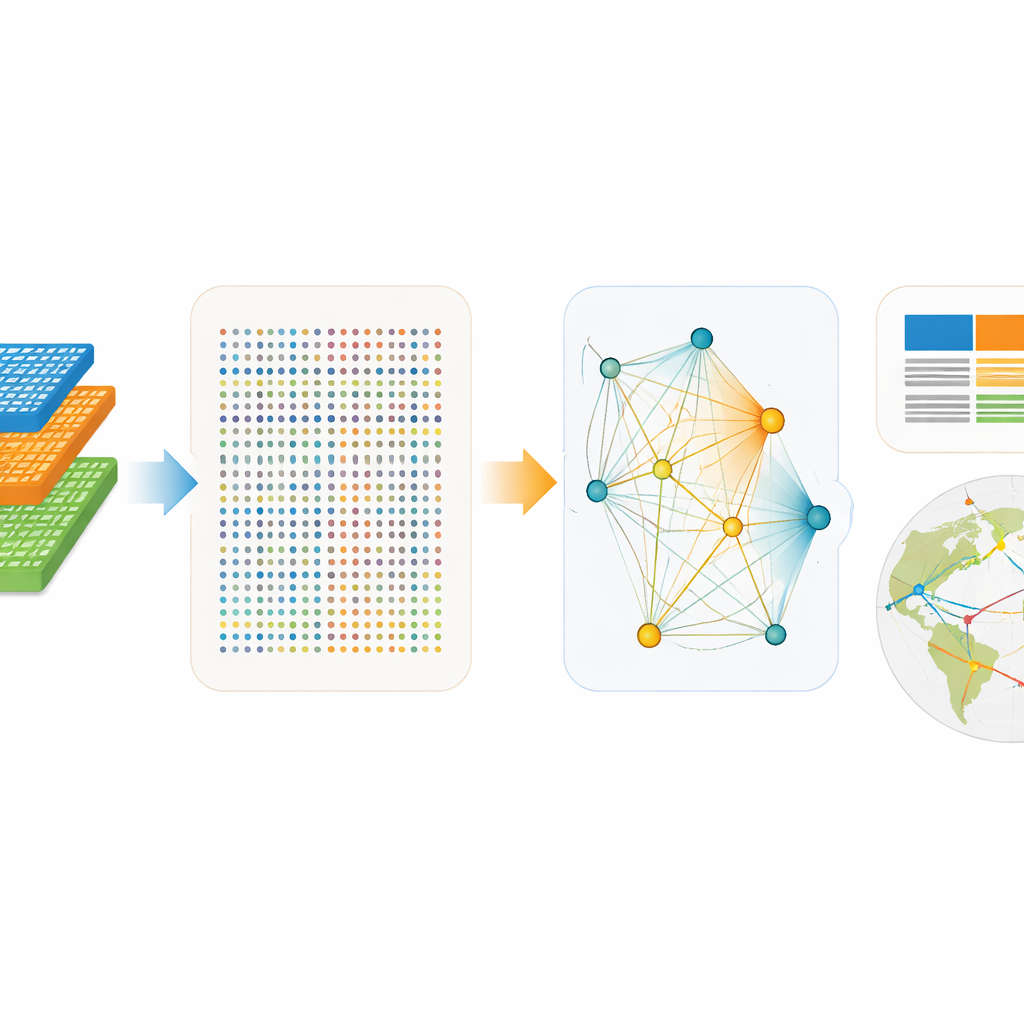
The raw EXIOBASE files are enormous—over 40 gigabytes of tables describing transactions between hundreds of sectors in dozens of regions, plus parallel records of emissions, resources, and energy use. The authors design ExioML to distill this complexity into two main pieces. The first is a “factor accounting” table: a neatly structured spreadsheet where each row is a specific sector in a specific region and year, with columns for value added, jobs, energy use, and greenhouse gas output. The second is a “footprint network”: a streamlined map of the strongest trade links between sectors, showing how money, energy, and emissions flow through the global economy. To produce these, they rely on high‑performance graphics‑processing units (GPUs) to crunch the demanding matrix calculations that trace emissions along supply chains, and they standardize units, sector codes, and naming so that all 49 regions and 28 years can be compared directly.
Built for Modern Machine Learning
ExioML is designed from the ground up with machine learning in mind. The dataset covers 49 regions from 1995 to 2022 and offers two compatible views: one split into 200 types of products and another into 163 industries. This structure lets researchers treat each sector–region–year as a data point, combining simple numerical features—like population, income per person, energy per unit of output, or emissions per unit of energy—with categorical information about where and what the sector is. The authors also publish an open‑source software package that can load the data, generate network summaries, and even supply ready‑made training, validation, and test splits. This lowers the barrier for both climate scientists and data scientists who want to build models without first becoming experts in specialized economic accounting.
Testing How Well Models Can Predict Emissions
To show how ExioML can be used, the authors set up a benchmark task: predicting a sector’s greenhouse gas emissions from a small set of economic and energy‑related indicators. They compare classic machine‑learning models, such as nearest neighbors and tree‑based ensembles, with modern deep‑learning approaches that can automatically learn feature combinations. After careful data cleaning, scaling, and splitting, they find that simple linear models struggle, confirming that the relationship between production, jobs, energy use, and emissions is highly nonlinear. Tree‑based methods and neural networks both perform well, with a gated neural model achieving the best accuracy. However, the improvement over well‑tuned gradient‑boosted trees is modest, while the deep models take much longer to train and are harder to fine‑tune.
What This Means for Climate and Data Work
For non‑specialists, the key message is that ExioML turns an opaque tangle of global economic and environmental data into a shared, open foundation that anyone can build on. Companies trying to understand the climate impact of their purchases, researchers designing algorithms to spot high‑emission hotspots, and analysts exploring how policy or technology changes might shift future emissions can all work from the same transparent resource. The study shows that with the right structure, even relatively simple machine‑learning tools can capture much of the hidden pattern in emissions across sectors and regions. By combining openness, technical rigor, and practical software, ExioML helps move carbon accounting from a patchwork of private estimates toward a more reproducible, data‑driven science.
Citation: Guo, Y., Guan, C. & Ma, J. Global emission factor dataset for Scope 3 machine learning applications. Sci Data 13, 348 (2026). https://doi.org/10.1038/s41597-026-06699-1
Keywords: Scope 3 emissions, carbon accounting, input–output analysis, machine learning, supply chain emissions